Prerequisites
This section opens Chapter 21. You should have completed Chapter 9: Vibe Coding, which introduced the verify-or-repair loop and executable contracts, and Chapter 18: AI-Assisted Testing, which covered test generation strategies that feed directly into CI pipelines. Familiarity with Git version control, basic YAML syntax, and command-line tools is assumed.
A CI/CD pipeline is a discovery loop. Each iteration takes a hypothesis (a code change), subjects it to a battery of automated experiments (builds, tests, security scans, performance benchmarks), and produces a verdict: deploy or reject. The pipeline's configuration is itself an artifact that evolves through discovery, as teams learn which checks catch real problems and which are noise. AI transforms this loop by predicting which tests will fail before running them, generating pipeline configurations from repository structure, and optimizing build parallelism to minimize feedback latency. This section builds that intelligence from the ground up, starting with the anatomy of a CI/CD pipeline and ending with an AI agent that generates complete workflows from natural language.
Common Misconception
A frequent misunderstanding is that "continuous deployment" means every commit automatically reaches production without human oversight. In practice, most teams implement continuous delivery, where every commit is automatically tested and packaged into a deployable artifact, but a human decision (or a policy gate such as a schedule or a feature flag) controls when that artifact actually reaches production. Fully automated continuous deployment does exist, but it requires mature monitoring, automated rollback, and high test coverage to be safe; it is an advanced practice, not the default.
1. Anatomy of a CI/CD Pipeline
What if every line of code you pushed was automatically compiled, tested against thousands of cases, scanned for known vulnerabilities, and deployed to a staging environment, all within three minutes of your commit? That is the promise of a Continuous Integration / Continuous Deployment (CI/CD) pipeline: a sequence of stages that transforms source code into running software with no manual steps in between. The canonical stages are: source (trigger on commit or pull request), build (compile, resolve dependencies, produce artifacts), test (unit, integration, end-to-end), security (static analysis, dependency scanning, secret detection), package (container image, binary, archive), deploy (staging, canary (where a small fraction of traffic is routed to the new version before full rollout), production), and monitor (health checks, rollback triggers). Each stage gates the next: a failure at any point halts the pipeline and notifies the team. Figure 21.1 illustrates this stage-gate flow, including the parallel fork where independent stages run concurrently. Figure 21.1.1 illustrates CI/CD pipeline stage-gate architecture with parallel fan-out and fan-in.
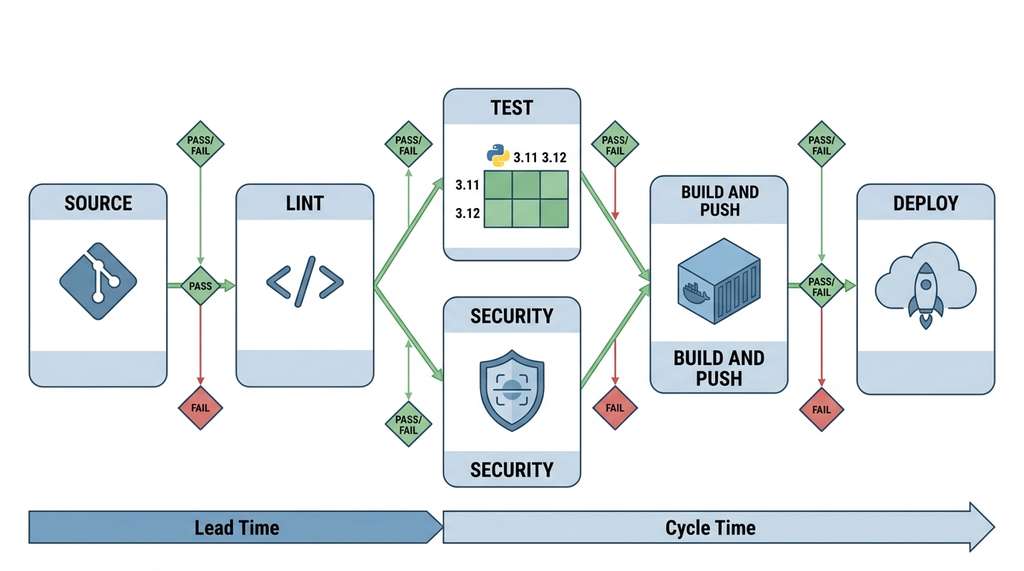
A CI/CD pipeline is an automated assembly line. It takes every proposed code change and subjects it to a fixed sequence of quality checks before that change can reach users. It matters because without automation, teams rely on manual testing and ad hoc deployment procedures, which are slow, error-prone, and scale poorly as codebases grow. The mechanism is event-driven: a version control event (such as a push or pull request) triggers a workflow engine. The engine spins up isolated compute environments, runs each stage's commands, and collects pass/fail results. It then promotes the artifact to the next stage or halts with a notification. Use a CI/CD pipeline whenever multiple developers contribute to a shared codebase. For solo projects with infrequent releases, a pre-commit hook or manual test script may suffice until missed-bug costs exceed pipeline setup costs. In short: every commit is a hypothesis, and the pipeline is the experiment that accepts or rejects it before users ever see the result.
Measuring Pipeline Performance
Two metrics capture pipeline efficiency. Lead time measures the wall-clock time from commit to production deployment. Cycle time measures the time a change spends actively being processed. The ratio between them reveals queuing waste:
$$\text{Pipeline Efficiency} = \frac{\text{Cycle Time}}{\text{Lead Time}} = \frac{\sum_{i=1}^{n} t_{\text{active},i}}{\sum_{i=1}^{n} (t_{\text{active},i} + t_{\text{wait},i})}$$A pipeline with 80% efficiency spends only 20% of its time waiting (for runners, approvals, or queued jobs). Industry benchmarks from the DevOps Research and Assessment (DORA) metrics research show that elite teams achieve lead times under one hour and deploy multiple times per day (circa 2023). AI-assisted optimization targets the waiting time by predicting which stages can run in parallel and which tests can be safely skipped for a given change.
With this abstract model of pipeline stages and efficiency metrics in hand, the next question is how to express these stages as executable configuration that a CI platform can run automatically on every commit.
2. GitHub Actions: Workflow as Code
GitHub Actions represents CI/CD pipelines as YAML (YAML Ain't Markup Language) workflow files stored in
.github/workflows/. A workflow consists of one or more jobs, each
running on a runner (a virtual machine or container), composed of sequential
steps that execute shell commands or reusable actions. Jobs within a
workflow run in parallel by default; explicit needs dependencies create
sequential ordering. This declarative structure (specifying what the pipeline should do rather than scripting how to execute each step) makes workflows amenable to AI generation,
because the configuration space is well-defined and the semantics are documented.
# .github/workflows/ci.yml
# A multi-stage CI pipeline for a Python scientific computing project
name: CI Pipeline

on:
  push:
    branches: [main]
  pull_request:
    branches: [main]

jobs:
  lint:
    runs-on: ubuntu-latest
    steps:
      - uses: actions/checkout@v4
      - uses: actions/setup-python@v5
        with:
          python-version: "3.12"
      - run: pip install ruff mypy
      - run: ruff check src/        # Fast linting (seconds)
      - run: mypy src/ --strict     # Type checking

  test:
    needs: lint                      # Only test if lint passes
    runs-on: ubuntu-latest
    strategy:
      matrix:
        python-version: ["3.11", "3.12"]  # Matrix build
    steps:
      - uses: actions/checkout@v4
      - uses: actions/setup-python@v5
        with:
          python-version: ${{ matrix.python-version }}
      - run: pip install -e ".[test]"
      - run: pytest tests/ --cov=src --cov-report=xml
      - uses: codecov/codecov-action@v4   # Upload coverage

  security:
    needs: lint
    runs-on: ubuntu-latest
    steps:
      - uses: actions/checkout@v4
      - run: pip install pip-audit safety
      - run: pip-audit                     # Dependency vulnerabilities
      - run: safety scan                   # Known Common Vulnerabilities and Exposures (CVEs) (as of 2024, Safety CLI 3.x replaced `safety check` with `safety scan`)

  build-and-push:
    needs: [test, security]         # Fan-in: both must pass
    if: github.ref == 'refs/heads/main'
    runs-on: ubuntu-latest
    steps:
      - uses: actions/checkout@v4
      - uses: docker/build-push-action@v5
        with:
          push: true
          tags: ghcr.io/${{ github.repository }}:latest
The workflow encodes key design decisions: lint first for fast feedback, parallel test and
security stages after lint (using a matrix build, which runs the same job multiple times with different configurations such as Python versions), and Docker builds only on main after both gates pass. The Docker containerization used in the final build-and-push job is covered in detail in the next subsection. Each
decision is a configuration choice an AI agent can reason about from repository structure
and team priorities.
3. Docker: Reproducible Build Environments
Containers solve the "works on my machine" problem by packaging an application with its
entire runtime environment. A Dockerfile is a declarative specification of how
to build that environment, and it follows the same principle as
Chapter 3's
knowledge representations: an explicit, machine-readable description of a complex system.
Multi-stage builds separate the build environment (compilers, development tools) from the
runtime environment (minimal base image, application binary), reducing the final image size
and attack surface.
# Multi-stage Dockerfile for a Python scientific computing service
# Stage 1: Build dependencies (large image with compilers)
FROM python:3.12-slim AS builder

WORKDIR /app
COPY pyproject.toml .
COPY src/ src/

# Install build dependencies and compile C extensions
RUN pip install --no-cache-dir build \
    && python -m build --wheel

# Stage 2: Runtime (minimal image)
FROM python:3.12-slim AS runtime

WORKDIR /app

# Install only the wheel, no compilers needed
COPY --from=builder /app/dist/*.whl .
RUN pip install --no-cache-dir *.whl \
    && rm *.whl

# Non-root user for security
RUN useradd --create-home appuser
USER appuser

# Health check for orchestration platforms
HEALTHCHECK --interval=30s --timeout=5s --retries=3 \
    CMD python -c "import urllib.request; urllib.request.urlopen('http://localhost:8000/health')"

EXPOSE 8000
CMD ["python", "-m", "discovery_service", "--host", "0.0.0.0", "--port", "8000"]Containers give each pipeline stage a reproducible runtime, but the compute, networking, and storage that host those containers need their own declarative specification.
4. Infrastructure as Code with Terraform
Infrastructure as Code (IaC) applies the same version-control discipline to infrastructure
that Git applies to source code. Terraform uses a declarative language, HashiCorp Configuration Language (HCL), to describe
the desired state of cloud resources. The terraform plan command computes the
diff between desired and actual state. Then terraform apply executes the minimal
set of changes. This plan-apply cycle mirrors the hypothesis-experiment-result loop of
Chapter 1:
declare what you want (hypothesis), let Terraform compute what needs to change (experiment
design), and let the cloud provider execute the changes (experiment).
"""
AI-assisted Terraform configuration generator.
Given a natural language description of infrastructure requirements,
generates HCL configuration using a large language model (LLM) with structured output.
"""
from dataclasses import dataclass, field
from anthropic import Anthropic


@dataclass
class InfraRequirement:
    """Parsed infrastructure requirement."""
    service_name: str
    compute_type: str           # "container", "serverless", "vm"
    replicas: int = 1
    cpu_cores: float = 1.0
    memory_gb: float = 2.0
    storage_gb: float = 10.0
    needs_database: bool = False
    needs_redis: bool = False
    region: str = "us-east-1"


def generate_terraform(requirement: InfraRequirement) -> str:
    """Generate Terraform HCL from a structured requirement.

    This function demonstrates the pattern of converting a high-level
    specification into infrastructure code. In production, you would
    validate the output against organizational policies and cost limits.
    """
    # Build the infrastructure description for the LLM
    spec = f"""Generate Terraform HCL configuration for:
- Service: {requirement.service_name}
- Type: {requirement.compute_type}
- Replicas: {requirement.replicas}
- Resources: {requirement.cpu_cores} CPU, {requirement.memory_gb}GB RAM
- Storage: {requirement.storage_gb}GB
- Database: {"PostgreSQL RDS" if requirement.needs_database else "none"}
- Cache: {"ElastiCache Redis" if requirement.needs_redis else "none"}
- Region: {requirement.region}

Requirements:
1. Use AWS provider with proper resource naming
2. Include security groups with least-privilege rules
3. Add CloudWatch alarms for CPU and memory
4. Tag all resources with service name and environment
5. Output the service URL and database connection string

Return ONLY valid Terraform HCL. No markdown fences."""

    client = Anthropic()
    response = client.messages.create(
        model="claude-sonnet-4-20250514",
        max_tokens=4096,
        messages=[{"role": "user", "content": spec}]
    )
    return response.content[0].text


def validate_terraform_plan(hcl_content: str) -> dict:
    """Validate generated Terraform by running a dry-run plan.

    Returns a dictionary with:
    - valid: bool indicating if the plan succeeded
    - resources_to_create: count of new resources
    - resources_to_destroy: count of resources to remove
    - estimated_cost: monthly cost estimate (if available)
    - warnings: list of policy violations
    """
    import subprocess
    import tempfile
    import json
    import os

    with tempfile.TemporaryDirectory() as tmpdir:
        tf_file = os.path.join(tmpdir, "main.tf")
        with open(tf_file, "w") as f:
            f.write(hcl_content)

        # Initialize Terraform providers
        init_result = subprocess.run(
            ["terraform", "init", "-backend=false"],
            cwd=tmpdir, capture_output=True, text=True
        )
        if init_result.returncode != 0:
            return {"valid": False, "error": init_result.stderr}

        # Generate plan in JSON format for programmatic analysis
        plan_result = subprocess.run(
            ["terraform", "plan", "-out=plan.tfplan", "-no-color"],
            cwd=tmpdir, capture_output=True, text=True
        )

        # Convert plan to JSON for structured analysis
        show_result = subprocess.run(
            ["terraform", "show", "-json", "plan.tfplan"],
            cwd=tmpdir, capture_output=True, text=True
        )

        if show_result.returncode == 0:
            plan_data = json.loads(show_result.stdout)
            changes = plan_data.get("resource_changes", [])
            return {
                "valid": True,
                "resources_to_create": sum(
                    1 for c in changes if "create" in c.get("change", {}).get("actions", [])
                ),
                "resources_to_destroy": sum(
                    1 for c in changes if "delete" in c.get("change", {}).get("actions", [])
                ),
                "warnings": []
            }

        return {"valid": False, "error": plan_result.stderr}
Infrastructure drift occurs when the actual state of deployed resources diverges from the
declared state in code. Terraform's plan command detects this drift automatically.
AI adds value by explaining the drift: was it caused by a manual hotfix during an
incident? A scaling event that modified resource counts? A security patch applied by the
cloud provider? Classifying drift by cause enables teams to decide which changes to codify
and which to revert, turning operational noise into architectural knowledge.
5. AI-Assisted Pipeline Optimization
When a CI pipeline runs 2,400 tests on every push, developers stop waiting for results and context-switch to other work, turning a three-minute feedback loop into a 45-minute interruption that fragments their entire afternoon. That cost compounds across every engineer on the team, every day.
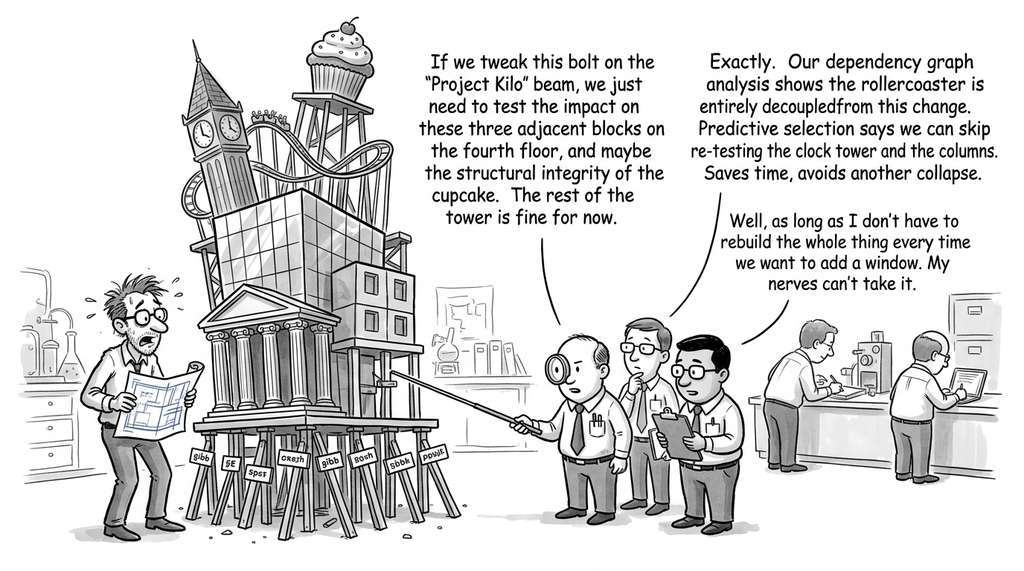
The most impactful application of AI to CI/CD is predictive test selection, and it is also where the "discovery" framing becomes most concrete: the AI agent searches the space of possible test failures, guided by learned heuristics, to locate the relevant failures as quickly as possible. Given a code change, the system predicts which tests are likely to fail and runs only those tests first. This transforms the test stage from an exhaustive sweep into a targeted search, reducing feedback time from minutes (or hours, for large test suites) to seconds. The technique relies on learning the mapping between code changes and test outcomes from historical pipeline data.
Mental Model
Predictive test selection works like a doctor triaging patients in an emergency room. Rather than giving every patient the full battery of tests on arrival, the triage nurse checks vital signs and symptoms (the features of the code change), compares them against known patterns of serious conditions (historical failure data), and sends the highest-risk patients to examination first. Low-risk patients still get seen eventually (the full test suite runs nightly), but the critical cases get immediate attention. The "co-change score" is like noticing that a patient came from the same accident scene as someone already in critical care: the shared context raises the probability that this patient also needs urgent attention.
We model predictive test selection as a binary classification problem. For each test \(t_i\) and code change \(\Delta c\), we want to predict the probability that the test will fail:
$$P(\text{fail} \mid t_i, \Delta c) = \sigma\left(\mathbf{w}^T \phi(t_i, \Delta c) + b\right)$$where \(\phi(t_i, \Delta c)\) extracts features from the test-change pair (files touched, functions modified, historical co-failure patterns), \(\sigma\) is the sigmoid function (which maps any real number to a probability between 0 and 1), and \(\mathbf{w}\) and \(b\) are learned parameters. Tests are then ordered by predicted failure probability, and the pipeline runs the most likely failures first.
Checkpoint
So far: predictive test selection frames each CI run as a search problem, using a binary classifier (sigmoid over learned feature weights) to rank every test by its probability of failure given the current code change, so the pipeline can fail fast on the highest-risk tests.
If any test in the high-risk set fails, the pipeline stops immediately, saving the time that would have been spent on lower-risk tests.
"""
Predictive test selection: prioritize tests most likely to fail
given a code change, using historical CI data.
"""
import numpy as np
from dataclasses import dataclass


@dataclass
class TestRunRecord:
    """A single test execution from CI history."""
    test_name: str
    files_changed: list[str]     # Files modified in the commit
    passed: bool
    duration_seconds: float
    commit_sha: str


def extract_features(
    test_name: str,
    changed_files: list[str],
    history: list[TestRunRecord]
) -> np.ndarray:
    """Extract features for test-change pair prediction.

    Features capture the relationship between code changes and test
    outcomes, enabling the model to learn which changes are risky
    for which tests.
    """
    # Filter history to this specific test
    test_history = [r for r in history if r.test_name == test_name]
    if not test_history:
        # New test: assign maximum risk (conservative strategy)
        return np.array([1.0, 0.0, 0.0, 1.0, 0.0])

    total_runs = len(test_history)
    failure_rate = sum(1 for r in test_history if not r.passed) / total_runs

    # Co-change frequency: how often do changed files appear
    # in commits where this test failed?
    failed_runs = [r for r in test_history if not r.passed]
    if failed_runs:
        co_change_score = np.mean([
            len(set(changed_files) & set(r.files_changed)) / max(len(r.files_changed), 1)
            for r in failed_runs
        ])
    else:
        co_change_score = 0.0

    # Recency: when did this test last fail?
    # More recent failures increase risk
    recent_failures = sum(
        1 for r in test_history[-10:] if not r.passed
    )
    recency_score = recent_failures / min(10, total_runs)

    # Flakiness: tests that intermittently fail are higher risk
    if total_runs >= 5:
        outcomes = [r.passed for r in test_history[-20:]]
        transitions = sum(
            1 for i in range(1, len(outcomes)) if outcomes[i] != outcomes[i-1]
        )
        flakiness = transitions / len(outcomes)
    else:
        flakiness = 0.0

    # Average duration (for scheduling: run fast risky tests first)
    avg_duration = np.mean([r.duration_seconds for r in test_history])

    return np.array([
        failure_rate,
        co_change_score,
        recency_score,
        flakiness,
        avg_duration
    ])


def prioritize_tests(
    all_tests: list[str],
    changed_files: list[str],
    history: list[TestRunRecord],
    weights: np.ndarray | None = None
) -> list[tuple[str, float]]:
    """Rank tests by predicted failure probability.

    Returns tests sorted by risk score (highest first), enabling
    the CI pipeline to fail fast on the most likely failures.

    Args:
        all_tests: Names of all tests in the suite.
        changed_files: Files modified in the current commit.
        history: Historical test execution records.
        weights: Learned feature weights. If None, uses heuristic defaults.

    Returns:
        List of (test_name, risk_score) tuples, sorted by descending risk.
    """
    if weights is None:
        # Heuristic weights: prioritize co-change and recent failures
        weights = np.array([0.3, 0.35, 0.25, 0.05, 0.05])

    scored_tests = []
    for test_name in all_tests:
        features = extract_features(test_name, changed_files, history)
        # Weighted sum, clipped to [0, 1]
        risk_score = float(np.clip(np.dot(weights, features), 0.0, 1.0))
        scored_tests.append((test_name, risk_score))

    # Sort by risk (descending), then by duration (ascending) for ties
    scored_tests.sort(key=lambda x: (-x[1]))
    return scored_tests


# Example usage
if __name__ == "__main__":
    # Simulated CI history
    history = [
        TestRunRecord("test_parser", ["src/parser.py"], True, 2.1, "abc123"),
        TestRunRecord("test_parser", ["src/parser.py", "src/lexer.py"], False, 2.3, "def456"),
        TestRunRecord("test_api", ["src/api.py"], True, 5.4, "abc123"),
        TestRunRecord("test_api", ["src/api.py"], True, 5.2, "def456"),
        TestRunRecord("test_db", ["src/models.py"], False, 8.1, "abc123"),
        TestRunRecord("test_db", ["src/models.py"], True, 7.9, "def456"),
    ]

    ranked = prioritize_tests(
        all_tests=["test_parser", "test_api", "test_db"],
        changed_files=["src/parser.py"],
        history=history
    )

    for test_name, risk in ranked:
        print(f"  {test_name}: risk={risk:.3f}")
    # Output:
    #   test_parser: risk=0.475  (high: co-change with parser.py)
    #   test_db: risk=0.275     (medium: historical failures)
# test_api: risk=0.025 (low: always passes, no co-change)Step-Through: Predictive Test Selection Scoring
Trace through extract_features and prioritize_tests using the
example history from the code above, with changed_files = ["src/parser.py"]
and default weights [0.3, 0.35, 0.25, 0.05, 0.05].
test_parser (2 runs, 1 failure):
failure_rate = 1/2 = 0.50
co_change_score: the one failed run changed ["src/parser.py", "src/lexer.py"];
overlap with ["src/parser.py"] is 1 file out of 2, so score = 1/2 = 0.50
recency_score: 1 failure in last 10 runs (only 2 exist) = 1/2 = 0.50
flakiness: only 2 runs, below threshold of 5, so 0.0
avg_duration: (2.1 + 2.3)/2 = 2.2
features = [0.50, 0.50, 0.50, 0.0, 2.2]
risk = 0.3(0.50) + 0.35(0.50) + 0.25(0.50) + 0.05(0.0) + 0.05(2.2) = 0.15 + 0.175 + 0.125 + 0 + 0.11 = 0.56
test_db (2 runs, 1 failure):
failure_rate = 0.50; co_change_score: failed run changed ["src/models.py"],
overlap with ["src/parser.py"] is 0, so score = 0.0
recency_score = 0.50; flakiness = 0.0; avg_duration = 8.0
risk = 0.3(0.50) + 0.35(0.0) + 0.25(0.50) + 0.05(0.0) + 0.05(8.0) = 0.15 + 0 + 0.125 + 0 + 0.40 = 0.675
test_api (2 runs, 0 failures):
failure_rate = 0.0; co_change_score = 0.0 (no failures); recency_score = 0.0;
flakiness = 0.0; avg_duration = 5.3
risk = 0.0 + 0.0 + 0.0 + 0.0 + 0.05(5.3) = 0.265
Final ranking: test_db (0.675), test_parser (0.56), test_api (0.265). Note that test_db ranks higher than test_parser despite zero file overlap, because its long average duration heavily influences the weighted score. This reveals a quirk of including duration as a risk feature: slow tests score higher even when unrelated to the change, which may or may not be desirable depending on whether you want "risk of failure" or "cost of missing a failure."
In a representative scenario drawn from industry reports, a computational genomics startup ran 2,400 tests in their CI pipeline, taking 45 minutes per push. After implementing predictive test selection using six months of CI history, they ran the top-50 riskiest tests first (completing in 90 seconds) and deferred the full suite to a nightly build. Over three months, the fast test set reportedly caught 94% of real failures within the first two minutes. The remaining 6% were integration tests with external services whose failures were unrelated to code changes, and were better suited to periodic rather than per-commit execution. Lead time dropped from 45 minutes to under 3 minutes for the feedback that developers actually waited for.
6. AI-Generated Pipeline Configurations
Beyond optimizing existing pipelines, AI can generate entire CI/CD configurations from repository analysis. The approach works by inspecting the repository structure (languages used, dependency files, test directories, Docker presence) and generating a workflow that follows best practices for that stack. This is a direct application of the code generation patterns from Chapter 16, applied to infrastructure configuration rather than application code.
"""
AI-driven CI/CD pipeline generator.
Analyzes a repository and generates a GitHub Actions workflow.
"""
import os
from pathlib import Path
from dataclasses import dataclass, field
from anthropic import Anthropic


@dataclass
class RepoAnalysis:
    """Analysis of a repository's structure for pipeline generation."""
    languages: list[str] = field(default_factory=list)
    has_tests: bool = False
    test_framework: str = ""
    has_dockerfile: bool = False
    has_docker_compose: bool = False
    has_terraform: bool = False
    dependency_files: list[str] = field(default_factory=list)
    python_version: str = ""
    node_version: str = ""


def analyze_repository(repo_path: str) -> RepoAnalysis:
    """Scan a repository to determine its technology stack.

    Examines file extensions, configuration files, and directory
    structure to build a profile for pipeline generation.
    """
    analysis = RepoAnalysis()
    repo = Path(repo_path)

    # Detect languages by file extension
    extensions = set()
    for f in repo.rglob("*"):
        if f.is_file() and f.suffix:
            extensions.add(f.suffix.lower())

    lang_map = {
        ".py": "python", ".js": "javascript", ".ts": "typescript",
        ".go": "go", ".rs": "rust", ".java": "java",
        ".rb": "ruby", ".cpp": "cpp", ".c": "c"
    }
    analysis.languages = [
        lang_map[ext] for ext in extensions if ext in lang_map
    ]

    # Detect dependency files
    dep_files = [
        "pyproject.toml", "requirements.txt", "setup.py",
        "package.json", "Cargo.toml", "go.mod", "Gemfile",
        "pom.xml", "build.gradle"
    ]
    analysis.dependency_files = [
        f for f in dep_files if (repo / f).exists()
    ]

    # Detect test infrastructure
    test_dirs = ["tests", "test", "spec", "__tests__"]
    analysis.has_tests = any((repo / d).is_dir() for d in test_dirs)

    if (repo / "pyproject.toml").exists():
        content = (repo / "pyproject.toml").read_text()
        if "pytest" in content:
            analysis.test_framework = "pytest"
        elif "unittest" in content:
            analysis.test_framework = "unittest"

    # Detect container and IaC files
    analysis.has_dockerfile = (repo / "Dockerfile").exists()
    analysis.has_docker_compose = (
        (repo / "docker-compose.yml").exists()
        or (repo / "docker-compose.yaml").exists()
    )
    analysis.has_terraform = any(repo.rglob("*.tf"))

    return analysis


def generate_pipeline(analysis: RepoAnalysis) -> str:
    """Generate a GitHub Actions workflow from repository analysis.

    Uses the repository profile to create a pipeline with appropriate
    stages, tools, and configurations for the detected stack.
    """
    client = Anthropic()

    prompt = f"""Generate a GitHub Actions workflow (.github/workflows/ci.yml)
for a repository with this profile:

Languages: {', '.join(analysis.languages)}
Test framework: {analysis.test_framework or 'none detected'}
Has tests: {analysis.has_tests}
Has Dockerfile: {analysis.has_dockerfile}
Has Docker Compose: {analysis.has_docker_compose}
Has Terraform: {analysis.has_terraform}
Dependency files: {', '.join(analysis.dependency_files)}

Requirements:
1. Trigger on push to main and pull requests
2. Include linting appropriate for the detected languages
3. Run tests if a test framework is detected
4. Build Docker image if Dockerfile exists
5. Run terraform plan (not apply) if .tf files exist
6. Cache dependencies for faster builds
7. Use matrix builds for multiple language versions if applicable
8. Add security scanning (dependency audit)

Return ONLY valid YAML. No markdown fences or explanations."""

    response = client.messages.create(
        model="claude-sonnet-4-20250514",
        max_tokens=4096,
        messages=[{"role": "user", "content": prompt}]
    )
return response.content[0].textReal-World Application: Google's Test Acceleration Framework
Google's internal CI system uses a tool called TAP (Test Automation Platform) that applies
predictive test selection at enormous scale. TAP analyzes the dependency graph of the entire
monorepo (a single repository containing code for multiple projects or services; billions of lines of code) and selects only the tests whose transitive dependencies (the full chain of modules a test depends on, including indirect imports) overlap with a given change. Combined with historical failure data, TAP reportedly reduces the average
number of tests per commit from hundreds of thousands to a few thousand, typically keeping median
feedback time under 10 minutes even as the codebase grows. The same principle powers the
open-source Bazel build system's --test_tag_filters and remote caching features.
The from-scratch approach above teaches the principles, but production tools already solve
parts of this problem. GitHub's starter workflows
(actions/starter-workflows) provide templates for 200+ language and framework
combinations. Renovate and Dependabot automate dependency
updates with CI integration. Dagger (dagger.io) lets you define
CI pipelines in Python, Go, or TypeScript instead of YAML, with built-in caching and
portability across CI providers (as of 2025, Dagger has added a public module registry and Dagger Cloud for pipeline visualization and caching across teams). Using Dagger, the 80-line YAML workflow above reduces to
roughly 30 lines of Python, and the pipeline runs identically on GitHub Actions, GitLab CI,
or a developer's laptop. The AI generation approach remains valuable for one-shot bootstrap
and for organizations with custom pipeline patterns that templates do not cover.
Generating a pipeline configuration is only half the challenge; teams also need to predict how long that pipeline will take, so they can allocate runners and set realistic expectations for developer feedback loops.
7. Build Time Prediction and Optimization
For large monorepos (repositories that consolidate multiple projects into a single version-controlled codebase), knowing how long a build will take is as valuable as knowing whether it will succeed. Build time prediction enables scheduling (running fast builds in the interactive pipeline, deferring slow builds to async queues) and resource allocation (scaling runners for heavy builds, using smaller instances for light ones). The prediction model uses features from the commit (number of files changed, types of files, affected build targets) and from the build environment (runner type, cache hit rate, time of day).
A simple but effective predictor uses the log-normal distribution (a probability distribution whose logarithm is normally distributed, producing a right-skewed shape), reflecting the empirical observation that build times are right-skewed (most builds are fast, but some are very slow):
$$\log(T) \sim \mathcal{N}(\mu(\mathbf{x}), \sigma^2(\mathbf{x}))$$where \(T\) is the build time, \(\mathbf{x}\) is the feature vector, and both \(\mu\) and \(\sigma^2\) are learned functions of the features. This gives not just a point prediction but a full distribution, enabling probabilistic scheduling: "this build has a 90% chance of finishing within 8 minutes."
"""
Build time prediction using log-normal regression.
Predicts both expected duration and confidence intervals.
"""
import numpy as np
from sklearn.linear_model import LinearRegression
from dataclasses import dataclass


@dataclass
class BuildRecord:
    """Historical build execution record."""
    files_changed: int
    lines_changed: int
    test_count: int
    cache_hit_ratio: float    # 0.0 to 1.0
    runner_cpus: int
    duration_seconds: float


def train_build_predictor(
    records: list[BuildRecord],
) -> tuple[LinearRegression, float]:
    """Train a log-normal build time predictor.

    Returns the trained model and the residual standard deviation
    (for constructing prediction intervals).
    """
    X = np.array([
        [r.files_changed, r.lines_changed, r.test_count,
         r.cache_hit_ratio, r.runner_cpus]
        for r in records
    ])

    # Log-transform the target (build durations are right-skewed)
    y = np.log(np.array([r.duration_seconds for r in records]))

    model = LinearRegression()
    model.fit(X, y)

    # Residual std for prediction intervals
    residuals = y - model.predict(X)
    sigma = float(np.std(residuals))

    return model, sigma


def predict_build_time(
    model: LinearRegression,
    sigma: float,
    files_changed: int,
    lines_changed: int,
    test_count: int,
    cache_hit_ratio: float,
    runner_cpus: int,
    confidence: float = 0.9
) -> dict:
    """Predict build duration with confidence interval.

    Returns expected time, median time, and upper bound at the
    specified confidence level.
    """
    from scipy import stats

    features = np.array([[
        files_changed, lines_changed, test_count,
        cache_hit_ratio, runner_cpus
    ]])

    log_mean = float(model.predict(features)[0])

    # Log-normal distribution properties
    median = np.exp(log_mean)                           # Median
    expected = np.exp(log_mean + sigma**2 / 2)          # Mean (E[T])
    z = stats.norm.ppf((1 + confidence) / 2)            # z-score
    upper_bound = np.exp(log_mean + z * sigma)          # Upper CI

    return {
        "median_seconds": round(median, 1),
        "expected_seconds": round(expected, 1),
        f"upper_{int(confidence*100)}pct_seconds": round(upper_bound, 1)
}Recent work pushes beyond static pipeline generation into autonomous CI repair loops. The CIGAR system (Widyasari et al., 2024, "CIGAR: Cost-Efficient GitHub Actions Repair with LLMs") uses large language models to automatically diagnose and fix broken GitHub Actions workflows by analyzing error logs, correlating them with documentation and Stack Overflow solutions, and generating targeted patches. On a benchmark of 600+ real-world CI failures from open-source repositories, CIGAR resolved 67% of configuration errors on the first attempt and 82% with a single retry that feeds the error output back to the model. This connects to the repair loop pattern from Chapter 9: generate, verify, repair. More broadly, the 2024 "AI for DevOps" survey by Nass et al. identifies predictive failure analysis and self-healing pipelines as the two most active research directions, with multiple systems now closing the loop from failure detection to automated fix without human intervention. As of 2025, GitHub Copilot and similar coding assistants have begun integrating CI log analysis directly into pull request workflows, automatically suggesting fixes for common build and test failures within the developer's editor.
The \$440 Million Deploy with No Rollback
On August 1, 2012, Knight Capital deployed new trading software to production without a proper CI/CD pipeline or automated rollback. A technician had manually copied files to seven of eight servers, leaving one server running old code that interpreted new order flags as a defunct test routine. In 45 minutes the system executed four million erroneous trades, losing \$440 million and nearly bankrupting the firm. The postmortem identified the root cause as a manual deployment process with no automated verification step. Knight Capital is now the canonical case study for why "deploy" and "verify" must be a single atomic operation, not two separate human tasks.
Try It: Build a Predictive Test Selector from Synthetic CI Logs
1. Create a small Python project with three modules (parser.py,
api.py, db.py) and at least two tests per module using
pytest. Commit this to a local Git repository.
2. Write a script that simulates 200 CI runs by generating random
TestRunRecord entries (use the dataclass from this section). Inject
realistic patterns: make test_parser fail 40% of the time when
parser.py changes, and make test_db flaky (10% random failure
regardless of files changed). Save the records as a JSON file.
3. Implement the extract_features and prioritize_tests
functions from this section. Run them against your synthetic history with a change to
parser.py and verify that test_parser ranks highest.
4. Replace the heuristic weights with a scikit-learn
LogisticRegression trained on 80% of your synthetic data. Evaluate precision
and recall on the held-out 20%. Print a classification report using
sklearn.metrics.classification_report.
5. Compute the time savings: compare the total test duration when running all tests
versus running only tests above a 0.3 risk threshold. Report the percentage of failures
caught and the percentage of total test time saved.
Lab: Measure Predictive Test Selection on a Real Repository
Goal: Quantify how much CI time predictive test selection saves on an
actual open-source project's test history.
Tools: Python 3.11+, pytest, scikit-learn,
gitpython, and a GitHub repository with at least 200 commits and a
pytest test suite (good candidates: httpx, pydantic,
or flask).
Procedure (25 minutes):
1. Clone the repository and use gitpython to iterate over the last 200 commits,
recording which files each commit changed.
2. For each commit, run pytest --co -q (collect only) to list the test names
without executing them. Map each test file to the source files it imports.
3. For 50 of those commits, run the full test suite and record pass/fail outcomes and
durations. This is your labeled dataset.
4. Implement extract_features from this section using your real data. Train a
LogisticRegression on 40 commits and evaluate on the remaining 10.
5. Plot two curves: (a) cumulative failure recall vs. fraction of tests run, and
(b) cumulative test time vs. fraction of tests run. The area between the "run all" diagonal
and your model's curve is your time savings.
What to vary: Try different feature subsets (drop flakiness, drop duration)
and observe which features contribute most to recall. Try thresholds of 0.2, 0.3, and 0.5
and report the recall/time tradeoff at each.
What to observe: How steep is the recall curve in the first 10% of tests?
Does the model generalize across different parts of the commit history, or does it degrade
on older commits where the codebase structure was different?
Exercises
A data science team has a monorepo with three components: a Python data pipeline, a
React dashboard, and shared Protobuf schemas. Design a CI/CD pipeline (on paper or as
YAML) that (a) only runs tests for components affected by a change, (b) rebuilds the
Protobuf stubs when .proto files change, and (c) deploys the dashboard only
when both its tests and the data pipeline's integration tests pass. What is the minimum
number of jobs needed, and what are the dependency edges?
Extend the prioritize_tests function to learn feature weights from historical
data using logistic regression. Use the CI history to fit the model, then evaluate its
precision and recall on a held-out set of pipeline runs. What is the minimum risk threshold
that catches 95% of real test failures?
Take a Dockerfile from an open-source project and analyze it for optimization opportunities:
layer ordering (put rarely-changing layers first), multi-stage builds (separate build-time
from runtime dependencies), and cache utilization (.dockerignore to exclude
unnecessary files). Measure the image size before and after your optimizations. Use an LLM
to generate the optimized version and compare it to your manual approach.