Prerequisites
This section synthesizes the CI/CD pipeline patterns from Section 21.1 and the observability and incident analysis techniques from Section 21.2 into an integrated system. You should also be familiar with the multi-agent orchestration patterns from Chapter 17 and the MCP server architecture from Chapter 12, as the agent-assisted pipeline uses both. The Discovery Workbench integration connects to the system architecture established in Chapter 6.
The previous two sections built the components: CI/CD pipelines that transform code into deployments, and observability systems that detect and diagnose failures. This section connects them into a closed loop. An AI agent monitors the pipeline, interprets failures, suggests fixes, and feeds operational insights back into the development process. The result is not just automation (running predefined steps faster) but intelligence (adapting the pipeline based on what it learns). This closes the discovery loop that began in Chapter 1: the pipeline observes outcomes, updates its model of what works, and adjusts its strategy for the next iteration.
1. Architecture of an Agent-Assisted Pipeline
A flaky network test fails at 2 a.m. on a commit that changed only a configuration comment, and the pipeline blocks a critical hotfix for forty minutes because static conditional logic cannot distinguish a real regression from irrelevant noise. An agent-assisted pipeline solves this by wrapping each stage with an AI layer that can observe, decide, and act. The agent does not replace the pipeline; it augments it. The pipeline still runs builds, tests, and deployments through deterministic tools (GitHub Actions, Docker, Terraform). The agent adds three capabilities: pre-stage analysis (should we skip or modify this stage based on the change?), failure interpretation (what does this error mean, and can we fix it automatically?), and cross-stage learning (how should we adjust future stages based on what happened in earlier ones?). Figure 21.3.1 illustrates Agent-assisted CI/CD pipeline closed-loop architecture.
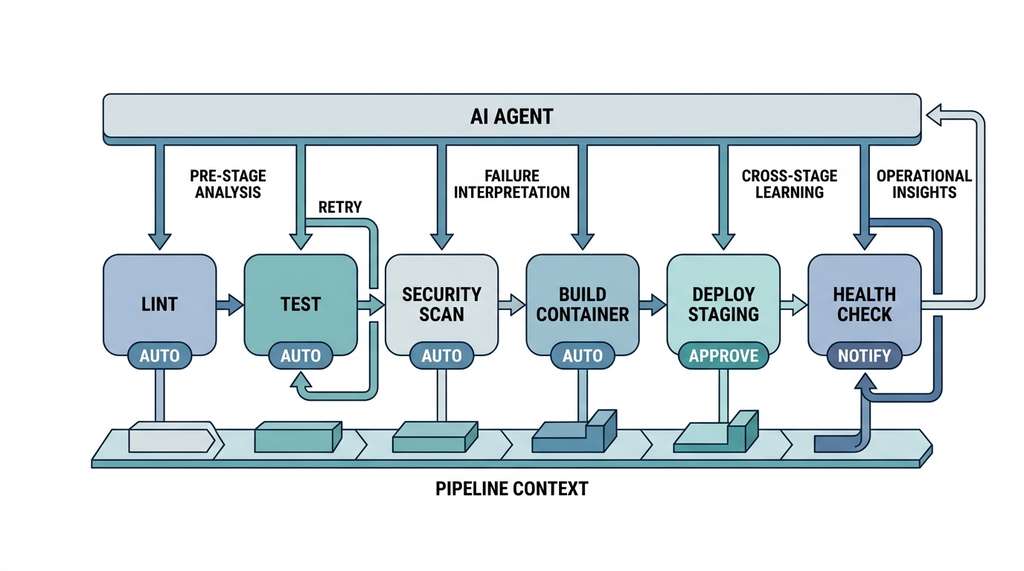
Figure 21.3.1 illustrates the overall flow. Each CI/CD stage (where CI/CD stands for continuous integration and continuous delivery, the practice of automatically building, testing, and deploying code on every commit) feeds its result into the AI agent, which decides whether to proceed, retry, skip, or escalate before the next stage begins.
Common Misconception
A frequent misconception is that "agent-assisted" means the AI agent decides whether code reaches production. In this architecture the agent never holds unilateral authority over irreversible actions; it proposes, and a human (or a strict policy gate) approves. The agent's value is in interpreting ambiguous signals and filtering noise, not in replacing the approval chain.
An agent-assisted pipeline places a language model between CI/CD stages. The model consumes structured events (build logs, test verdicts, deployment status codes) and emits structured actions (skip, retry, escalate, roll back). Traditional pipelines follow static "if red then stop" logic. An agent, by contrast, weighs ambiguous signals: a test that fails only on certain data, an error message that implies a transient network blip. It chooses the response most likely to keep the release moving safely. Each stage publishes its result as a JSON object; the agent reads that object alongside accumulated context from earlier stages, queries a large language model (LLM) with a constrained prompt, and maps the LLM's structured reply to a concrete pipeline action. Use an agent-assisted pipeline when your failure modes are diverse enough that hand-written conditional logic would become unmanageable. For pipelines with only one or two stages and deterministic outcomes, a "fail and alert" strategy is cheaper and easier to audit.
The architecture follows the tool-use agent pattern from Chapter 12. Each pipeline stage exposes its inputs and outputs through a structured interface. The agent receives events from the pipeline (stage started, stage completed, stage failed) and queries tools for context: build logs, test results, deployment status, monitoring metrics. Based on that context, it acts: retry a stage, skip a stage, create an issue, or trigger a rollback. A policy bounds the agent's decisions, defining what it can do autonomously (retry a flaky test) and what requires human approval (deploy to production, roll back a release).
"""
Agent-assisted CI/CD pipeline orchestrator.
Wraps pipeline stages with AI-driven decision making for
failure interpretation, adaptive test selection, and
automated remediation.
"""
from dataclasses import dataclass, field
from enum import Enum
from datetime import datetime
from typing import Callable
from anthropic import Anthropic


class StageStatus(Enum):
    PENDING = "pending"
    RUNNING = "running"
    PASSED = "passed"
    FAILED = "failed"
    SKIPPED = "skipped"
    RETRIED = "retried"


class ApprovalLevel(Enum):
    AUTO = "auto"           # Agent can act without human approval
    NOTIFY = "notify"       # Agent acts and notifies human
    APPROVE = "approve"     # Agent proposes, human approves


@dataclass
class StageResult:
    """Result of a pipeline stage execution."""
    stage_name: str
    status: StageStatus
    duration_seconds: float
    output: str                # Stdout/stderr from the stage
    artifacts: dict = field(default_factory=dict)  # Produced files, images, etc.
    error_message: str = ""
    retry_count: int = 0


@dataclass
class PipelineStage:
    """Definition of a pipeline stage with agent policies."""
    name: str
    execute: Callable              # Function that runs the stage
    approval_level: ApprovalLevel  # What the agent can do autonomously
    max_retries: int = 2           # Maximum automatic retries
    skip_conditions: list[str] = field(default_factory=list)  # When to skip


@dataclass
class PipelineContext:
    """Accumulated context across pipeline stages."""
    commit_sha: str
    changed_files: list[str]
    commit_message: str
    author: str
    branch: str
    stage_results: list[StageResult] = field(default_factory=list)
    agent_decisions: list[dict] = field(default_factory=list)


class AgentPipeline:
    """AI-augmented CI/CD pipeline orchestrator.

    Wraps each pipeline stage with an AI agent that can:
    1. Decide whether to skip a stage based on the change
    2. Interpret failures and suggest fixes
    3. Retry stages with modified parameters
    4. Escalate to humans when confidence is low
    """

    def __init__(self, stages: list[PipelineStage]):
        self.stages = stages
        self.client = Anthropic()

    def should_skip_stage(
        self, stage: PipelineStage, context: PipelineContext
    ) -> tuple[bool, str]:
        """Ask the agent whether a stage should be skipped.

        Uses the commit diff and stage skip conditions to decide.
        Returns (should_skip, reason).
        """
        if not stage.skip_conditions:
            return False, ""

        prompt = f"""Given this code change, should the "{stage.name}" stage be skipped?

Changed files: {', '.join(context.changed_files)}
Commit message: {context.commit_message}

Skip conditions for this stage:
{chr(10).join(f'- {c}' for c in stage.skip_conditions)}

Previous stage results:
{chr(10).join(f'- {r.stage_name}: {r.status.value}' for r in context.stage_results)}

Respond with EXACTLY one line:
SKIP:
or
RUN: """

        response = self.client.messages.create(
            model="claude-sonnet-4-20250514",
            max_tokens=200,
            messages=[{"role": "user", "content": prompt}]
        )
        answer = response.content[0].text.strip()

        if answer.startswith("SKIP:"):
            return True, answer[5:].strip()
        return False, answer.replace("RUN:", "").strip()

    def interpret_failure(
        self, stage: PipelineStage, result: StageResult, context: PipelineContext
    ) -> dict:
        """Analyze a stage failure and recommend next steps.

        Returns a structured interpretation with:
        - root_cause: What likely caused the failure
        - is_transient: Whether retrying might fix it
        - fix_suggestion: How to fix it (if possible)
        - should_retry: Whether the agent recommends a retry
        - should_block: Whether this failure should block the pipeline
        """
        prompt = f"""A CI/CD pipeline stage failed. Analyze the failure.

Stage: {stage.name}
Retry count: {result.retry_count} / {stage.max_retries}
Error: {result.error_message}

Stage output (last 2000 chars):
{result.output[-2000:]}

Changed files: {', '.join(context.changed_files)}

Previous stages:
{chr(10).join(f'- {r.stage_name}: {r.status.value}' for r in context.stage_results)}

Analyze and respond in this exact format:
ROOT_CAUSE:
IS_TRANSIENT:
FIX_SUGGESTION:
SHOULD_RETRY:
SHOULD_BLOCK:
CONFIDENCE: """

        response = self.client.messages.create(
            model="claude-sonnet-4-20250514",
            max_tokens=500,
            messages=[{"role": "user", "content": prompt}]
        )

        # Parse structured response
        lines = response.content[0].text.strip().split("\n")
        interpretation = {}
        for line in lines:
            if ":" in line:
                key, value = line.split(":", 1)
                interpretation[key.strip().lower()] = value.strip()

        return {
            "root_cause": interpretation.get("root_cause", "unknown"),
            "is_transient": interpretation.get("is_transient", "").lower() == "yes",
            "fix_suggestion": interpretation.get("fix_suggestion", "none"),
            "should_retry": (
                interpretation.get("should_retry", "").lower() == "yes"
                and result.retry_count < stage.max_retries
            ),
            "should_block": interpretation.get("should_block", "").lower() != "no",
            "confidence": interpretation.get("confidence", "low"),
            "raw_analysis": response.content[0].text
        }

    def run(self, context: PipelineContext) -> dict:
        """Execute the full pipeline with agent assistance.

        Returns a summary of all stages, decisions, and outcomes.
        """
        pipeline_start = datetime.now()

        for stage in self.stages:
            # Pre-stage: check if we should skip
            should_skip, skip_reason = self.should_skip_stage(stage, context)

            if should_skip:
                result = StageResult(
                    stage_name=stage.name,
                    status=StageStatus.SKIPPED,
                    duration_seconds=0,
                    output=f"Skipped by agent: {skip_reason}"
                )
                context.stage_results.append(result)
                context.agent_decisions.append({
                    "stage": stage.name,
                    "decision": "skip",
                    "reason": skip_reason,
                    "timestamp": datetime.now().isoformat()
                })
                continue

            # Execute the stage (with retry loop)
            retry_count = 0
            while True:
                import time
                start = time.time()
                try:
                    output = stage.execute(context)
                    result = StageResult(
                        stage_name=stage.name,
                        status=StageStatus.PASSED,
                        duration_seconds=time.time() - start,
                        output=output,
                        retry_count=retry_count
                    )
                    break
                except Exception as e:
                    result = StageResult(
                        stage_name=stage.name,
                        status=StageStatus.FAILED,
                        duration_seconds=time.time() - start,
                        output=str(e),
                        error_message=str(e),
                        retry_count=retry_count
                    )

                    # Agent interprets the failure
                    interpretation = self.interpret_failure(
                        stage, result, context
                    )

                    context.agent_decisions.append({
                        "stage": stage.name,
                        "decision": "interpret_failure",
                        "interpretation": interpretation,
                        "timestamp": datetime.now().isoformat()
                    })

                    if interpretation["should_retry"] and retry_count < stage.max_retries:
                        retry_count += 1
                        result.status = StageStatus.RETRIED
                        context.stage_results.append(result)
                        continue
                    else:
                        # Failure is final
                        if interpretation["should_block"]:
                            context.stage_results.append(result)
                            return self._build_summary(
                                context, pipeline_start, blocked_by=stage.name
                            )
                        break

            context.stage_results.append(result)

        return self._build_summary(context, pipeline_start)

    def _build_summary(
        self,
        context: PipelineContext,
        start_time: datetime,
        blocked_by: str = ""
    ) -> dict:
        """Build a structured pipeline execution summary."""
        end_time = datetime.now()
        total_duration = (end_time - start_time).total_seconds()

        return {
            "commit": context.commit_sha,
            "branch": context.branch,
            "status": "blocked" if blocked_by else "completed",
            "blocked_by": blocked_by,
            "total_duration_seconds": round(total_duration, 1),
            "stages": [
                {
                    "name": r.stage_name,
                    "status": r.status.value,
                    "duration": round(r.duration_seconds, 1),
                    "retries": r.retry_count
                }
                for r in context.stage_results
            ],
            "agent_decisions": context.agent_decisions,
            "stages_skipped": sum(
                1 for r in context.stage_results
                if r.status == StageStatus.SKIPPED
            ),
            "stages_retried": sum(
                1 for r in context.stage_results
                if r.status == StageStatus.RETRIED
            )
} Mental Model
Think of cross-stage learning like a seasoned airport gate agent handling a delayed
flight. The gate agent does not just look at the current boarding pass; she checks
whether the inbound aircraft arrived late (earlier stage), whether connecting passengers
need rebooking (downstream impact), and whether this route has a pattern of weather
delays at this time of year (historical context). Each decision incorporates information
from other stages of the journey, and the accumulation of that context is what separates
a smooth recovery from a cascade of missed connections. In the pipeline, the
PipelineContext object plays the same role as the gate agent's situational
awareness: it carries forward every earlier stage's outcome so that later decisions
(should we retry? should we skip?) account for what has already happened, not just what
is happening right now. In short: the pipeline carries context forward so every decision reflects the full history of the run, not just the current stage's exit code.
The ApprovalLevel enum encodes a critical design principle: not all pipeline
actions should be fully autonomous. Retrying a flaky test is safe to automate (AUTO level).
Skipping a security scan should notify the team (NOTIFY level). Deploying to production or
rolling back a release should require human approval (APPROVE level). This graduated
autonomy mirrors the trust calibration discussed in
Chapter 17: start with narrow
autonomy on low-risk actions, expand as the agent demonstrates reliability, and always
maintain human oversight on irreversible operations.
Step-Through: Agent Failure Interpretation Loop
Trace through the agent's decision logic for a pipeline with three stages (lint, test, build) where the test stage fails twice before succeeding on the third attempt.
Iteration 1: stage = lint. should_skip_stage checks
skip_conditions against changed files (["src/model.py"]); Python file changed, so
skip = False. stage.execute(context) returns "Lint passed: 1 file checked."
Status: PASSED. retry_count = 0. Result appended to context.stage_results.
Iteration 2, attempt 1: stage = test. No skip_conditions, so
skip = False. stage.execute(context) raises RuntimeError("Tests failed: 1
assertion error"). Agent calls interpret_failure. LLM returns:
root_cause = "assertion mismatch in updated module",
is_transient = yes, should_retry = yes,
confidence = medium. Check: retry_count (0) < max_retries (2)
is True. Set retry_count = 1, status = RETRIED. Continue loop.
Iteration 2, attempt 2: stage.execute(context) raises again.
interpret_failure returns should_retry = yes. Check:
retry_count (1) < max_retries (2) is True. Set retry_count = 2,
status = RETRIED. Continue loop.
Iteration 2, attempt 3: stage.execute(context) succeeds.
Status: PASSED. retry_count = 2. Break out of retry loop.
Iteration 3: stage = build. Executes, succeeds. Final summary:
3 stages total, 0 skipped, 2 retries, status = "completed".
2. Defining Pipeline Stages
When a stage fails, the agent's ability to diagnose the problem depends entirely on the structure of that stage's output; an opaque exit code forces the agent to guess, while a well-formatted result lets it pinpoint the root cause and decide whether to retry, skip, or escalate.
Each concrete pipeline stage is a function that takes the pipeline context and returns output text (or raises an exception on failure). The stages below implement a realistic pipeline for a Python scientific computing service, combining the CI/CD patterns from Section 21.1 with the observability checks from Section 21.2.
"""
Concrete pipeline stage implementations for a scientific
computing service. Each stage performs a real build/test/deploy
operation and returns structured output for the agent.
"""
import subprocess
import json
import os


def stage_lint(context: PipelineContext) -> str:
    """Run linting and type checking on changed Python files."""
    python_files = [f for f in context.changed_files if f.endswith(".py")]
    if not python_files:
        return "No Python files changed, lint passed trivially."

    # Run ruff for fast linting
    result = subprocess.run(
        ["ruff", "check"] + python_files,
        capture_output=True, text=True
    )
    if result.returncode != 0:
        raise RuntimeError(f"Lint failed:\n{result.stdout}\n{result.stderr}")

    # Run mypy for type checking
    result = subprocess.run(
        ["mypy", "--strict"] + python_files,
        capture_output=True, text=True
    )
    if result.returncode != 0:
        raise RuntimeError(f"Type check failed:\n{result.stdout}")

    return f"Lint passed: {len(python_files)} files checked."


def stage_test(context: PipelineContext) -> str:
    """Run tests with predictive selection for fast feedback."""
    # Use predictive test selection from Section 21.1
    result = subprocess.run(
        ["pytest", "tests/", "-x",          # Stop on first failure
         "--tb=short",                        # Short tracebacks
         "--cov=src", "--cov-report=json",    # Coverage reporting
         "-q"],                               # Quiet output
        capture_output=True, text=True
    )

    output = result.stdout + result.stderr

    if result.returncode != 0:
        raise RuntimeError(f"Tests failed:\n{output}")

    # Parse coverage report
    cov_file = "coverage.json"
    if os.path.exists(cov_file):
        with open(cov_file) as f:
            cov_data = json.load(f)
        total_cov = cov_data.get("totals", {}).get("percent_covered", 0)
        output += f"\nCoverage: {total_cov:.1f}%"

    return output


def stage_security_scan(context: PipelineContext) -> str:
    """Run dependency vulnerability scanning."""
    result = subprocess.run(
        ["pip-audit", "--format=json"],
        capture_output=True, text=True
    )

    if result.returncode != 0:
        try:
            vulnerabilities = json.loads(result.stdout)
            high_severity = [
                v for v in vulnerabilities
                if v.get("severity", "").upper() in ("HIGH", "CRITICAL")
            ]
            if high_severity:
                raise RuntimeError(
                    f"Found {len(high_severity)} high/critical vulnerabilities:\n"
                    + "\n".join(
                        f"  {v['name']} {v['version']}: {v['description']}"
                        for v in high_severity[:5]
                    )
                )
        except json.JSONDecodeError:
            raise RuntimeError(f"Security scan error:\n{result.stderr}")

    return "Security scan passed: no high/critical vulnerabilities."


def stage_build_container(context: PipelineContext) -> str:
    """Build and tag a Docker container image."""
    tag = f"discovery-service:{context.commit_sha[:8]}"

    result = subprocess.run(
        ["docker", "build",
         "--tag", tag,
         "--label", f"commit={context.commit_sha}",
         "--label", f"branch={context.branch}",
         "."],
        capture_output=True, text=True
    )

    if result.returncode != 0:
        raise RuntimeError(f"Docker build failed:\n{result.stderr}")

    # Get image size
    inspect = subprocess.run(
        ["docker", "image", "inspect", tag, "--format", "{{.Size}}"],
        capture_output=True, text=True
    )
    size_mb = int(inspect.stdout.strip()) / (1024 * 1024) if inspect.returncode == 0 else 0

    return f"Built image {tag} ({size_mb:.1f} MB)"


def stage_deploy_staging(context: PipelineContext) -> str:
    """Deploy to staging environment and run smoke tests."""
    tag = f"discovery-service:{context.commit_sha[:8]}"

    # Deploy using kubectl or similar
    result = subprocess.run(
        ["kubectl", "set", "image",
         "deployment/discovery-service",
         f"discovery-service={tag}",
         "--namespace=staging"],
        capture_output=True, text=True
    )

    if result.returncode != 0:
        raise RuntimeError(f"Staging deploy failed:\n{result.stderr}")

    # Wait for rollout
    result = subprocess.run(
        ["kubectl", "rollout", "status",
         "deployment/discovery-service",
         "--namespace=staging",
         "--timeout=120s"],
        capture_output=True, text=True
    )

    if result.returncode != 0:
        raise RuntimeError(f"Staging rollout failed:\n{result.stderr}")

    return f"Deployed {tag} to staging. Rollout complete."


def stage_health_check(context: PipelineContext) -> str:
    """Verify the deployed service is healthy using golden signals."""
    import time

    # Wait for metrics to accumulate
    time.sleep(30)

    # Check golden signals (the four key metrics: latency,
    # traffic, errors, and saturation) against SLOs
    checks = {
        "latency_p99_ms": {"threshold": 500, "actual": 0},
        "error_rate_pct": {"threshold": 1.0, "actual": 0},
        "health_endpoint": {"status": "unknown"}
    }

    # Query Prometheus/Grafana for golden signals
    import urllib.request
    try:
        response = urllib.request.urlopen(
            "http://staging.internal:8000/health",
            timeout=10
        )
        checks["health_endpoint"]["status"] = "healthy"
    except Exception as e:
        raise RuntimeError(f"Health check failed: {e}")

    return json.dumps(checks, indent=2)


# Assemble the pipeline
def create_discovery_pipeline() -> AgentPipeline:
    """Create an agent-assisted pipeline for the Discovery service."""
    stages = [
        PipelineStage(
            name="lint",
            execute=stage_lint,
            approval_level=ApprovalLevel.AUTO,
            max_retries=0,
            skip_conditions=[
                "Only documentation files (.md, .rst, .txt) changed",
                "Only CI configuration files changed"
            ]
        ),
        PipelineStage(
            name="test",
            execute=stage_test,
            approval_level=ApprovalLevel.AUTO,
            max_retries=2,  # Retry for flaky tests
            skip_conditions=[]
        ),
        PipelineStage(
            name="security_scan",
            execute=stage_security_scan,
            approval_level=ApprovalLevel.NOTIFY,
            max_retries=1,
            skip_conditions=[
                "No dependency files (pyproject.toml, requirements.txt) changed"
            ]
        ),
        PipelineStage(
            name="build_container",
            execute=stage_build_container,
            approval_level=ApprovalLevel.AUTO,
            max_retries=1,
            skip_conditions=[]
        ),
        PipelineStage(
            name="deploy_staging",
            execute=stage_deploy_staging,
            approval_level=ApprovalLevel.APPROVE,  # Human approval required
            max_retries=1,
            skip_conditions=[]
        ),
        PipelineStage(
            name="health_check",
            execute=stage_health_check,
            approval_level=ApprovalLevel.AUTO,
            max_retries=3,  # Health checks may need retries
            skip_conditions=[]
        ),
    ]

return AgentPipeline(stages)3. Synthetic Incident Injection and Postmortem
The pipeline stages above handle the happy path and routine failures, but the most revealing test of any agent-assisted system is how it responds to scenarios it has never encountered before.
The most effective way to improve incident response is to practice it. Chaos engineering tools like Netflix's Chaos Monkey inject real failures into production systems (as of 2024, the chaos engineering toolkit has expanded well beyond Chaos Monkey to include platforms such as Gremlin, Litmus, and AWS Fault Injection Service, but the core principle of controlled fault injection remains the same). A safer alternative is synthetic incident injection, where faults are simulated in a staging environment, followed by an AI-generated postmortem. This gives teams the learning benefits of real incidents without the production risk.
A synthetic incident consists of three components: the fault (what breaks), the scenario (the sequence of observable symptoms), and the resolution (what fixes it). The AI agent generates scenarios modeled on common failure modes and evaluates the team's (or another agent's) response.
Checkpoint
So far: a synthetic incident has three components (fault, scenario, resolution), and the generator produces all three from templates so that teams can practice incident response without risking production.
"""
Synthetic incident generator and postmortem exercise.
Creates realistic incident scenarios for training and evaluation,
then generates AI-assisted postmortem reports.
"""
import random
from dataclasses import dataclass, field
from datetime import datetime, timedelta
from anthropic import Anthropic


@dataclass
class SyntheticFault:
    """A simulated fault injected into the system."""
    fault_type: str           # "latency", "error", "resource_exhaustion", "data_corruption"
    target_service: str
    severity: str             # "P1", "P2", "P3"
    description: str
    observable_symptoms: list[str]
    root_cause: str
    resolution_steps: list[str]


@dataclass
class IncidentScenario:
    """A complete incident scenario with timeline and telemetry."""
    fault: SyntheticFault
    timeline: list[dict]         # [{time_offset_min, event, source}]
    metrics_snapshot: dict       # Golden signal values during incident
    log_samples: list[str]       # Representative log lines
    trace_anomalies: list[dict]  # Slow or errored spans


# Common production failure modes for scenario generation
FAULT_TEMPLATES = [
    SyntheticFault(
        fault_type="latency",
        target_service="database",
        severity="P2",
        description="Database connection pool exhaustion due to leaked connections",
        observable_symptoms=[
            "P99 latency increases from 200ms to 5000ms over 15 minutes",
            "Active database connections climb steadily toward the pool limit",
            "Error rate increases as connection acquire timeouts begin",
            "Upstream services show cascading latency increases"
        ],
        root_cause="A recent code change introduced a code path that acquires "
                   "database connections but does not release them on exception, "
                   "causing the connection pool to fill over time",
        resolution_steps=[
            "Identify the leaking code path using connection pool metrics",
            "Restart affected service instances to release leaked connections",
            "Deploy a hotfix wrapping the database call in a context manager",
            "Add connection pool monitoring with alerts at 80% utilization"
        ]
    ),
    SyntheticFault(
        fault_type="error",
        target_service="api_gateway",
        severity="P1",
        description="Certificate expiry causing TLS handshake failures",
        observable_symptoms=[
            "Error rate jumps from 0.1% to 100% at a specific timestamp",
            "All errors are TLS handshake failures (SSL_ERROR_EXPIRED_CERT)",
            "Health check endpoints return connection refused",
            "No gradual degradation; failure is instantaneous"
        ],
        root_cause="The TLS certificate for the API gateway expired at the "
                   "exact timestamp of the error spike. Certificate renewal "
                   "automation failed silently 30 days ago",
        resolution_steps=[
            "Renew the TLS certificate manually or via ACME (Automatic Certificate Management Environment)",
            "Reload the API gateway configuration to pick up the new cert",
            "Investigate why the automated renewal failed",
            "Add certificate expiry monitoring with 30-day advance warning"
        ]
    ),
    SyntheticFault(
        fault_type="resource_exhaustion",
        target_service="compute_worker",
        severity="P2",
        description="Memory leak in experiment processing workers",
        observable_symptoms=[
            "Worker memory usage increases linearly at 50MB per hour",
            "Workers begin OOM-killing after approximately 8 hours",
            "Job completion rate drops as workers restart",
            "Job queue depth increases as processing capacity decreases"
        ],
        root_cause="A new feature caches intermediate computation results "
                   "in memory without an eviction policy. Each experiment "
                   "adds to the cache but nothing removes entries",
        resolution_steps=[
            "Add a maximum cache size with LRU (least recently used) eviction",
            "Restart workers on a rolling schedule as an immediate fix",
            "Add memory usage alerts at 80% of container limit",
            "Implement periodic cache statistics logging for monitoring"
        ]
    ),
    SyntheticFault(
        fault_type="data_corruption",
        target_service="storage",
        severity="P1",
        description="Schema migration applied without backward compatibility",
        observable_symptoms=[
            "Some API endpoints return 500 errors with serialization failures",
            "Errors correlate with specific data records (old format vs new)",
            "New records work correctly; old records fail",
            "Error rate is proportional to the fraction of old records accessed"
        ],
        root_cause="A database migration renamed a column without a "
                   "backward-compatible transition period. Records created "
                   "before the migration reference the old column name",
        resolution_steps=[
            "Add the old column back as an alias or computed column",
            "Deploy a data migration to backfill old records",
            "Establish a migration policy requiring backward compatibility",
            "Add integration tests that verify old and new record formats"
        ]
    ),
]


def generate_incident_scenario(
    fault: SyntheticFault | None = None,
    duration_minutes: int = 45
) -> IncidentScenario:
    """Generate a complete incident scenario with synthetic telemetry.

    Creates a realistic timeline, metrics snapshot, log samples,
    and trace anomalies for a given fault type.
    """
    if fault is None:
        fault = random.choice(FAULT_TEMPLATES)

    # Generate timeline
    timeline = []
    t = 0

    # Pre-incident: normal operations
    timeline.append({
        "time_offset_min": t,
        "event": "Deployment completed successfully",
        "source": "ci_pipeline"
    })

    # Fault begins (typically 5-15 minutes after deployment)
    onset = random.randint(5, 15)
    t = onset
    timeline.append({
        "time_offset_min": t,
        "event": f"First symptom: {fault.observable_symptoms[0]}",
        "source": "monitoring"
    })

    # Detection (TTD: typically 2-10 minutes after onset)
    ttd = random.randint(2, 10)
    t += ttd
    timeline.append({
        "time_offset_min": t,
        "event": "Alert fired: SLO violation detected",
        "source": "alertmanager"
    })
    timeline.append({
        "time_offset_min": t + 1,
        "event": "On-call engineer paged",
        "source": "pagerduty"
    })

    # Investigation
    t += 3
    timeline.append({
        "time_offset_min": t,
        "event": "On-call begins investigation, checks dashboards",
        "source": "human"
    })

    # Additional symptoms surface
    for i, symptom in enumerate(fault.observable_symptoms[1:], 1):
        t += random.randint(2, 5)
        timeline.append({
            "time_offset_min": t,
            "event": f"Observed: {symptom}",
            "source": "monitoring" if i % 2 == 0 else "human"
        })

    # Mitigation
    t += random.randint(5, 15)
    timeline.append({
        "time_offset_min": t,
        "event": f"Mitigation applied: {fault.resolution_steps[0]}",
        "source": "human"
    })

    # Resolution
    t += random.randint(5, 10)
    timeline.append({
        "time_offset_min": t,
        "event": "Service recovered, SLOs restored",
        "source": "monitoring"
    })

    # Generate synthetic metrics
    metrics_snapshot = {
        "latency_p99_ms": {
            "before": 200 + random.randint(0, 50),
            "during": 200 + random.randint(300, 4800) if fault.fault_type == "latency" else 200 + random.randint(0, 100),
            "after": 200 + random.randint(0, 50)
        },
        "error_rate_pct": {
            "before": round(0.1 + random.random() * 0.2, 2),
            "during": round(5.0 + random.random() * 90.0, 2) if fault.fault_type == "error" else round(0.5 + random.random() * 4.0, 2),
            "after": round(0.1 + random.random() * 0.2, 2)
        },
        "traffic_rps": {
            "before": 1000 + random.randint(0, 200),
            "during": 1000 + random.randint(-200, 200),
            "after": 1000 + random.randint(0, 200)
        },
        "cpu_pct": {
            "before": 40 + random.randint(0, 20),
            "during": 40 + random.randint(20, 50) if fault.fault_type == "resource_exhaustion" else 40 + random.randint(0, 20),
            "after": 40 + random.randint(0, 20)
        }
    }

    # Generate log samples
    log_samples = [
        f"[{fault.target_service}] INFO  Normal request processed in 45ms",
        f"[{fault.target_service}] WARN  {fault.observable_symptoms[0]}",
        f"[{fault.target_service}] ERROR {fault.description}",
        f"[{fault.target_service}] ERROR Retry attempt 1/3 failed",
        f"[{fault.target_service}] FATAL Service health check failed",
    ]

    # Generate trace anomalies
    trace_anomalies = [
        {
            "trace_id": f"trace-{random.randint(1000, 9999)}",
            "service": fault.target_service,
            "operation": "process_request",
            "duration_ms": random.randint(3000, 10000),
            "status": "error",
            "error": fault.description
        }
    ]

    return IncidentScenario(
        fault=fault,
        timeline=timeline,
        metrics_snapshot=metrics_snapshot,
        log_samples=log_samples,
        trace_anomalies=trace_anomalies
)A computational biology research platform used the synthetic incident generator to run monthly "game day" exercises. Each session picked a random fault template, injected it into the staging environment, and gave the on-call team 30 minutes to detect, diagnose, and mitigate the issue. The AI agent played two roles: it generated the incident scenario (so the exercise facilitator did not need to manually craft failures) and it generated a postmortem from the team's actions (so the retrospective started with a structured draft instead of a blank page). After six months, the team reported that their mean time to detect (TTD) dropped from 12 minutes to roughly 4 minutes, and their mean time to mitigate (TTM) dropped from 35 minutes to approximately 15 minutes (self-reported metrics; other process changes during the same period may have contributed). The improvement likely came not from faster typing or better tooling, but from pattern recognition : after practicing twelve synthetic incidents, the team had encountered enough failure modes to recognize real ones faster.
4. Running the Postmortem Exercise
The postmortem exercise combines the incident scenario with the AI-driven root cause analysis from Section 21.2. The flow is: generate a scenario, present the symptoms (without the root cause) to the participant, collect their investigation steps, then compare their diagnosis to the known root cause. Finally, the AI generates a complete postmortem document, where a blameless postmortem is a structured retrospective that focuses on systemic causes and process improvements rather than assigning individual fault.
"""
Complete postmortem exercise runner.
Generates a scenario, evaluates the response, and produces
a structured postmortem with lessons learned.
"""
from anthropic import Anthropic
from datetime import datetime, timedelta


def run_postmortem_exercise(scenario: IncidentScenario | None = None) -> dict:
    """Run a complete synthetic incident postmortem exercise.

    Returns a structured report comparing the expected and actual
    diagnosis, with a complete postmortem document.
    """
    if scenario is None:
        scenario = generate_incident_scenario()

    client = Anthropic()

    # Phase 1: Present symptoms and get AI diagnosis
    # (In a real exercise, a human would investigate here)
    symptoms_prompt = f"""You are an SRE investigating a production incident.
Here is what you can observe:

ALERT: SLO violation on {scenario.fault.target_service}

METRICS:
{_format_metrics(scenario.metrics_snapshot)}

RECENT LOGS:
{chr(10).join(scenario.log_samples)}

TRACE ANOMALIES:
{chr(10).join(str(t) for t in scenario.trace_anomalies)}

TIMELINE (so far):
{chr(10).join(f"  T+{e['time_offset_min']}m [{e['source']}]: {e['event']}" for e in scenario.timeline[:5])}

Based on these observations:
1. What is your top hypothesis for the root cause?
2. What additional information would you query?
3. What is your recommended immediate mitigation?

Be specific. Cite the evidence that supports your hypothesis."""

    diagnosis = client.messages.create(
        model="claude-sonnet-4-20250514",
        max_tokens=1500,
        messages=[{"role": "user", "content": symptoms_prompt}]
    ).content[0].text

    # Phase 2: Generate the postmortem
    now = datetime.now()
    incident_start = now - timedelta(minutes=scenario.timeline[-1]["time_offset_min"])

    postmortem_prompt = f"""Generate a complete blameless postmortem for this incident.

INCIDENT SUMMARY:
Service: {scenario.fault.target_service}
Severity: {scenario.fault.severity}
Description: {scenario.fault.description}

ACTUAL ROOT CAUSE:
{scenario.fault.root_cause}

RESOLUTION:
{chr(10).join(f"  {i+1}. {step}" for i, step in enumerate(scenario.fault.resolution_steps))}

FULL TIMELINE:
{chr(10).join(f"  T+{e['time_offset_min']}m [{e['source']}]: {e['event']}" for e in scenario.timeline)}

METRICS DURING INCIDENT:
{_format_metrics(scenario.metrics_snapshot)}

AI DIAGNOSIS (for comparison):
{diagnosis}

Generate the postmortem with these sections:
1. Executive Summary
2. Impact Assessment (estimate affected users, failed requests)
3. Timeline (table format)
4. Root Cause Analysis (blameless, technical)
5. What Went Well
6. What Could Be Improved
7. Action Items (with priority: P0/P1/P2, owner placeholder, due date)
8. Detection Gap Analysis (how could we have caught this sooner?)
9. Lessons Learned

Make it realistic, specific, and actionable."""

    postmortem = client.messages.create(
        model="claude-sonnet-4-20250514",
        max_tokens=4096,
        messages=[{"role": "user", "content": postmortem_prompt}]
    ).content[0].text

    return {
        "scenario": {
            "fault_type": scenario.fault.fault_type,
            "target_service": scenario.fault.target_service,
            "severity": scenario.fault.severity,
            "actual_root_cause": scenario.fault.root_cause,
        },
        "ai_diagnosis": diagnosis,
        "postmortem": postmortem,
        "exercise_metadata": {
            "generated_at": datetime.now().isoformat(),
            "incident_duration_min": scenario.timeline[-1]["time_offset_min"],
            "fault_template": scenario.fault.description
        }
    }


def _format_metrics(metrics: dict) -> str:
    """Format metrics snapshot for display."""
    lines = []
    for signal, values in metrics.items():
        lines.append(
            f"  {signal}: before={values['before']}, "
            f"during={values['during']}, after={values['after']}"
        )
return "\n".join(lines)5. Discovery Workbench Integration
Individual postmortems improve the team that writes them, but the real leverage comes from aggregating operational data across every pipeline run and every incident into a system that can surface patterns no single postmortem would reveal.
The agent-assisted pipeline feeds every run, incident, and postmortem into the Workbench's knowledge base. Over time, this data reveals which change types cause the most failures, which services are most fragile, and which team practices correlate with fewer incidents. This is operational discovery: the search and pattern-recognition principles from Chapter 1 applied to software delivery itself.
"""
Discovery Workbench integration for operational intelligence.
Stores pipeline runs, incidents, and postmortems as discoverable
knowledge in the Workbench's structured data store.
"""
from dataclasses import dataclass, field
from datetime import datetime
import json


@dataclass
class OperationalInsight:
    """A discoverable insight from pipeline or incident data."""
    insight_type: str        # "pipeline_pattern", "incident_pattern", "reliability_trend"
    title: str
    description: str
    evidence: dict
    confidence: float        # 0.0 to 1.0
    actionable: bool
    suggested_actions: list[str] = field(default_factory=list)
    related_chapters: list[str] = field(default_factory=list)


class OperationalKnowledgeBase:
    """Stores and queries operational knowledge for the Discovery Workbench.

    Aggregates pipeline runs, incidents, and postmortems into
    a searchable knowledge base that surfaces patterns and trends.
    """

    def __init__(self):
        self.pipeline_runs: list[dict] = []
        self.incidents: list[dict] = []
        self.postmortems: list[dict] = []

    def record_pipeline_run(self, summary: dict):
        """Record a pipeline execution for trend analysis."""
        summary["recorded_at"] = datetime.now().isoformat()
        self.pipeline_runs.append(summary)

    def record_incident(self, incident: dict):
        """Record an incident for pattern analysis."""
        incident["recorded_at"] = datetime.now().isoformat()
        self.incidents.append(incident)

    def record_postmortem(self, postmortem: dict):
        """Record a postmortem for knowledge accumulation."""
        postmortem["recorded_at"] = datetime.now().isoformat()
        self.postmortems.append(postmortem)

    def analyze_reliability_trends(self, days: int = 30) -> list[OperationalInsight]:
        """Analyze recent operational data for reliability trends.

        Identifies patterns in pipeline failures, incident frequency,
        and recovery times that suggest systemic issues or improvements.
        """
        insights = []

        # Analyze pipeline failure patterns
        if len(self.pipeline_runs) >= 10:
            recent_runs = self.pipeline_runs[-100:]
            failure_rate = sum(
                1 for r in recent_runs if r.get("status") == "blocked"
            ) / len(recent_runs)

            if failure_rate > 0.2:
                # Find the most common blocking stage
                blocking_stages = [
                    r.get("blocked_by", "unknown")
                    for r in recent_runs if r.get("status") == "blocked"
                ]
                if blocking_stages:
                    from collections import Counter
                    most_common = Counter(blocking_stages).most_common(1)[0]

                    insights.append(OperationalInsight(
                        insight_type="pipeline_pattern",
                        title=f"High pipeline failure rate: {failure_rate:.0%}",
                        description=(
                            f"The '{most_common[0]}' stage is the most common "
                            f"blocker, causing {most_common[1]} of "
                            f"{len(blocking_stages)} pipeline failures."
                        ),
                        evidence={
                            "failure_rate": failure_rate,
                            "most_common_blocker": most_common[0],
                            "blocker_count": most_common[1],
                            "sample_size": len(recent_runs)
                        },
                        confidence=min(len(recent_runs) / 50, 1.0),
                        actionable=True,
                        suggested_actions=[
                            f"Investigate recurring failures in '{most_common[0]}'",
                            "Review test stability and flakiness metrics",
                            "Consider adding retry logic or splitting the stage"
                        ],
                        related_chapters=[
                            "Chapter 18: AI-Assisted Testing",
                            "Chapter 22: MLOps and LLMOps"
                        ]
                    ))

        # Analyze incident recurrence
        if len(self.incidents) >= 5:
            service_incidents = {}
            for inc in self.incidents:
                svc = inc.get("target_service", "unknown")
                service_incidents.setdefault(svc, []).append(inc)

            for service, incs in service_incidents.items():
                if len(incs) >= 3:
                    insights.append(OperationalInsight(
                        insight_type="incident_pattern",
                        title=f"Recurring incidents in {service}",
                        description=(
                            f"Service '{service}' has had {len(incs)} incidents "
                            f"in the analysis period. This suggests a systemic "
                            f"reliability issue rather than isolated failures."
                        ),
                        evidence={
                            "service": service,
                            "incident_count": len(incs),
                            "severities": [i.get("severity") for i in incs]
                        },
                        confidence=0.8,
                        actionable=True,
                        suggested_actions=[
                            f"Conduct a reliability review of '{service}'",
                            "Review and address all open action items from postmortems",
                            "Consider architectural changes to improve resilience"
                        ],
                        related_chapters=[
                            "Chapter 6: Discovery System Architecture",
                            "Chapter 14: Discovery of Architectures"
                        ]
                    ))

        return insights

    def export_for_workbench(self) -> dict:
        """Export operational knowledge in Discovery Workbench format.

        Returns a structured dictionary suitable for ingestion into
        the Workbench's knowledge graph (Chapter 38) or experiment
        registry (Chapter 47).
        """
        return {
            "source": "devops_pipeline",
            "version": "1.0",
            "exported_at": datetime.now().isoformat(),
            "summary": {
                "total_pipeline_runs": len(self.pipeline_runs),
                "total_incidents": len(self.incidents),
                "total_postmortems": len(self.postmortems),
            },
            "pipeline_runs": self.pipeline_runs,
            "incidents": self.incidents,
            "postmortems": self.postmortems,
            "insights": [
                {
                    "type": i.insight_type,
                    "title": i.title,
                    "description": i.description,
                    "confidence": i.confidence,
                    "actions": i.suggested_actions
                }
                for i in self.analyze_reliability_trends()
            ]
}Research Frontier
The logical endpoint of agent-assisted pipelines is self-healing infrastructure: systems that detect, diagnose, and remediate failures without human intervention. A concrete step in this direction is Microsoft's RCACopilot (2024), an LLM-based on-call system that ingests alerts, retrieves similar past incidents, and produces root-cause diagnoses for cloud service outages. Evaluated on over 200 real incidents in Microsoft Azure and Microsoft 365, RCACopilot achieved a top-1 diagnostic accuracy above 80% for well-represented fault categories, substantially outperforming retrieval-only baselines. The key challenge remains composability: individual self-healing behaviors are well-understood, but their interactions can create feedback loops (auto-scaler fights rate-limiter) or cascading remediation (one service's rollback triggers another's health check failure, which triggers a third's rollback). The multi-agent coordination patterns from Chapter 17 and the causal reasoning from Chapter 31 are both essential for building self-healing systems that compose safely.
Real-World Application: GitHub Actions + Copilot Autofix
GitHub's Copilot Autofix (launched 2024) implements the agent-assisted pipeline pattern at scale across its hosted repository base. When a GitHub Actions workflow detects a code scanning alert (from CodeQL, a semantic code analysis engine that finds security vulnerabilities by treating code as queryable data, or a third-party static application security testing (SAST) tool), Copilot Autofix interprets the vulnerability, generates a concrete patch, and opens a pull request with the fix. The system uses the same bounded-autonomy principle shown in this section: it proposes fixes automatically but requires a human to merge, preserving the approval gate on irreversible changes to the codebase.
During testing of the postmortem generator, a team inadvertently created a recursive situation: the postmortem generation service itself experienced a timeout incident (the LLM API was rate-limited during a load test). The monitoring system detected the anomaly, the incident analysis pipeline diagnosed the root cause ("API rate limit exceeded for postmortem generation service"), and the postmortem generator produced a postmortem about its own failure. The action item: "Add rate limiting and retry logic to the postmortem generation service." The team framed the self-referential postmortem and hung it in the break room.
Try It: Build a Failure-Interpreting Pipeline Stub
You can build a minimal agent-assisted pipeline on your laptop using only the Python standard library and the Anthropic SDK. Follow these steps:
1. Create three shell commands that act as pipeline stages: a "lint" stage that always
succeeds (echo "lint OK"), a "test" stage that fails 50% of the time
(use random.random() to raise an exception on half the runs), and a
"build" stage that always succeeds.
2. Wire each command into a PipelineStage with
ApprovalLevel.AUTO, giving the test stage
max_retries=2.
3. Instantiate AgentPipeline with the three stages and a
PipelineContext populated with a dummy commit SHA and a list of two
Python file names.
4. Run pipeline.run(context) five times, collecting the returned
summaries. Print each summary's status, the number of stages skipped,
and the number of retries.
5. Inspect the agent_decisions list in the summary. For every
interpret_failure decision, print the root_cause and
confidence fields and compare them to the exception message your test
stage raised.
Lab: Build and Break a Three-Stage Agent Pipeline
Goal: Experience the agent's skip, retry, and escalation logic by running a miniature agent-assisted pipeline against faults you control.
Tools needed: Python 3.10+, the anthropic SDK
(pip install anthropic), and an API key set in
ANTHROPIC_API_KEY.
Setup (5 min): Copy the AgentPipeline orchestrator and the
three helper classes from this section into a file called lab_pipeline.py.
Create three stage functions: stage_a always succeeds,
stage_b raises RuntimeError("connection refused") on its
first call per run (use a module-level counter), and stage_c always
succeeds. Wire them into an AgentPipeline with
max_retries=2 for stage_b.
Experiment 1 (10 min): Run the pipeline five times. Record the
agent_decisions for each run. Observe whether the agent classifies
"connection refused" as transient (it should). Vary the error message to
"assertion error in test_model" and re-run. Does the agent's
is_transient judgment change?
Experiment 2 (10 min): Add skip_conditions=["Only
documentation files changed"] to stage_a. Run the pipeline once with
changed_files=["README.md"] and once with
changed_files=["src/model.py"]. Confirm that the agent skips
stage_a for the documentation-only change but runs it for the Python change.
What to observe: How consistently does the LLM classify transient vs. permanent errors? Does the classification change across runs with identical input? How sensitive is the skip decision to the phrasing of the skip condition?
Exercises
Design an approval policy for an agent-assisted pipeline serving a medical imaging analysis platform. For each of these actions, decide whether the approval level should be AUTO, NOTIFY, or APPROVE, and justify your choice: (a) retrying a failed unit test, (b) skipping a performance benchmark on a documentation-only change, (c) deploying a model update to staging, (d) deploying a model update to production, (e) rolling back a production deployment after detecting elevated error rates. Consider the regulatory requirements (Food and Drug Administration (FDA) guidelines for medical software) and the consequences of each action.
Add two new fault templates to the FAULT_TEMPLATES list: one for a DNS
resolution failure (a common cause of intermittent connectivity issues) and one for a
configuration deployment that introduces an incompatible feature flag. For each template,
specify the fault type, target service, severity, observable symptoms, root cause, and
resolution steps. Run the postmortem exercise with your new templates and evaluate whether
the AI diagnosis correctly identifies the root cause from the observable symptoms alone.
Using the OperationalKnowledgeBase, generate 50 synthetic pipeline runs with
varying failure rates and 10 synthetic incidents across three services. Run the
analyze_reliability_trends method and evaluate the quality of the generated
insights. Which patterns does the analyzer detect correctly? Which does it miss? Propose
two additional analysis methods (for example, detecting correlation between deployment
frequency and incident rate, or identifying the time-of-day pattern in failures) and
implement them.