Prerequisites
Section 22.1 established the Machine Learning Operations (MLOps) foundation: data pipelines, feature stores, experiment tracking, model registries, and distribution shift detection. Now we extend these patterns to large language models and autonomous agents, where the operational challenges shift from training reproducibility to prompt management, output evaluation, cost control, and trace observability. Familiarity with the LLM API patterns from Chapter 10 and the multi-agent orchestration from Chapter 17 will help ground the concepts.
Large Language Model Operations (LLMOps) is MLOps with different moving parts. In classical MLOps, the model is the artifact you version, train, evaluate, and deploy. In LLMOps, the model is a frozen API endpoint (GPT-4, Claude, Gemini) that you cannot modify. The artifacts you manage are prompts (system instructions, few-shot examples, where a few-shot example is a sample input/output pair included in the prompt to demonstrate the desired behavior, output schemas), retrieval contexts (which documents get injected), and evaluation harnesses (how you measure output quality). Agent Operations (AgentOps) adds another layer: when a single user request triggers a cascade of LLM calls, tool invocations, and branching decisions, you need to trace the full execution graph, attribute costs to each step, monitor tool reliability, and detect when an agent is stuck in a loop. This section builds the operational infrastructure for both. Figure 22.2 illustrates the end-to-end LLMOps lifecycle that connects these stages.
Common Misconception
Misconception: "LLMOps is just MLOps with a different model format." In classical MLOps you control the model artifact (weights, architecture, training data) and the inputs are fixed-schema features; in LLMOps you control only the instructions around a model you cannot retrain, and the "inputs" are natural-language prompts whose small wording changes cause large, unpredictable output shifts. This means the versioning, evaluation, and monitoring targets are fundamentally different, not just relabeled.
1. Prompt Versioning and Management
Production teams routinely discover that a one-word prompt edit has silently degraded output quality for hours, with no version history to identify the change and no rollback path to restore the previous behavior. That operational blind spot, where the most sensitive control surface in the system is also the least tracked, is what the infrastructure in this section is designed to close.
A prompt is code. It has parameters, produces outputs, and its behavior changes when you modify it. Yet most teams manage prompts as inline strings scattered across application code, with no version history, no A/B testing infrastructure, and no rollback capability. Prompt versioning treats prompts as first-class artifacts: stored in a registry, tagged with versions, evaluated against test suites, and deployed through the same staging pipeline as model weights.
Prompt versioning is a configuration management discipline. It records every change to a prompt template, its parameters (temperature, max tokens, model target), and its few-shot examples as an immutable, content-addressable snapshot (where "content-addressable" means the snapshot is identified by a hash of its contents, so identical content always maps to the same identifier). Teams can retrieve, compare, or roll back any snapshot at any time. Prompts are the primary control surface for LLM behavior. A one-word edit can shift output quality more than swapping the underlying model, so untracked changes make regression debugging impossible. The mechanism works like a source-control commit log specialized for prompts. Each version stores a content hash, evaluation scores from a test suite, and a deployment stage (draft, staging, production). Activating a new version or rolling back requires a single registry call. Use prompt versioning whenever your application serves more than one user or persists beyond a prototype; for quick single-developer experiments, a Git-tracked prompt file with manual notes suffices. In short: version your prompts with the same rigor you version your code, because in LLM applications the prompt is the code that matters most.
"""
A prompt registry that versions, stores, and serves prompts
with metadata for A/B testing and rollback.
"""
from dataclasses import dataclass, field
from datetime import datetime
from typing import Any
import json
import hashlib

@dataclass
class PromptVersion:
    """A versioned prompt template with metadata."""
    name: str
    version: int
    template: str
    model: str                  # Target model (e.g., "claude-sonnet-4-20250514")
    parameters: dict[str, Any]  # Temperature, max_tokens, etc.
    tags: list[str] = field(default_factory=list)
    created_at: str = field(
        default_factory=lambda: datetime.now().isoformat()
    )
    description: str = ""
    evaluation_scores: dict[str, float] = field(default_factory=dict)

    @property
    def content_hash(self) -> str:
        """Content-addressable hash for deduplication."""
        content = f"{self.template}|{json.dumps(self.parameters, sort_keys=True)}"
        return hashlib.sha256(content.encode()).hexdigest()[:12]


class PromptRegistry:
    """Version-controlled prompt storage with deployment stages."""

    def __init__(self):
        self._versions: dict[str, list[PromptVersion]] = {}
        self._active: dict[str, int] = {}  # name -> active version

    def register(self, prompt: PromptVersion) -> str:
        """Register a new prompt version."""
        if prompt.name not in self._versions:
            self._versions[prompt.name] = []
        self._versions[prompt.name].append(prompt)
        return f"{prompt.name}@v{prompt.version}"

    def activate(self, name: str, version: int) -> None:
        """Set the active (production) version of a prompt."""
        versions = self._versions.get(name, [])
        if not any(v.version == version for v in versions):
            raise ValueError(f"Version {version} not found for '{name}'")
        self._active[name] = version

    def get(self, name: str, version: int | None = None) -> PromptVersion:
        """Retrieve a prompt by name and optional version."""
        versions = self._versions.get(name, [])
        if not versions:
            raise KeyError(f"Prompt '{name}' not registered")
        if version is None:
            version = self._active.get(name, versions[-1].version)
        for v in versions:
            if v.version == version:
                return v
        raise KeyError(f"Version {version} not found for '{name}'")

    def render(self, name: str, variables: dict[str, str],
               version: int | None = None) -> str:
        """Render a prompt template with variables."""
        prompt = self.get(name, version)
        rendered = prompt.template
        for key, value in variables.items():
            rendered = rendered.replace(f"{{{{{key}}}}}", value)
        return rendered

    def diff(self, name: str, v1: int, v2: int) -> dict:
        """Compare two versions of a prompt."""
        p1 = self.get(name, v1)
        p2 = self.get(name, v2)
        return {
            "template_changed": p1.template != p2.template,
            "model_changed": p1.model != p2.model,
            "params_changed": p1.parameters != p2.parameters,
            "v1_scores": p1.evaluation_scores,
            "v2_scores": p2.evaluation_scores
        }


# Register prompt versions for a scientific literature analysis task
registry = PromptRegistry()

registry.register(PromptVersion(
    name="paper_summarizer",
    version=1,
    template="""Summarize the following scientific paper in 3-5 sentences.
Focus on: (1) the main hypothesis, (2) the methodology,
(3) the key results.

Paper: {{paper_text}}

Summary:""",
    model="claude-sonnet-4-20250514",
    parameters={"temperature": 0.3, "max_tokens": 500},
    tags=["literature", "summarization"],
    description="Basic paper summarization prompt"
))

registry.register(PromptVersion(
    name="paper_summarizer",
    version=2,
    template="""You are a scientific reviewer. Summarize this paper
using the following structure:

**Hypothesis:** [One sentence stating the central claim]
**Method:** [One sentence on the experimental/computational approach]
**Results:** [One to two sentences on key findings with numbers]
**Significance:** [One sentence on why this matters]

Paper: {{paper_text}}

Structured Summary:""",
    model="claude-sonnet-4-20250514",
    parameters={"temperature": 0.2, "max_tokens": 600},
    tags=["literature", "summarization", "structured"],
    description="Structured summarization with explicit sections"
))

registry.activate("paper_summarizer", version=2)In classical ML, the hyperparameter search space is well-defined: learning rate, batch size, regularization strength. In LLM applications, the prompt is the hyperparameter space, and it is vastly larger and less structured. Changing "Summarize this paper" to "You are a scientific reviewer. Summarize this paper" can, in some tasks, shift output quality more than changing the model itself. This is why prompt versioning is not optional tooling; it is the LLMOps equivalent of experiment tracking. Without it, you cannot answer the question "what changed between yesterday's good outputs and today's bad ones?"
2. LLM Evaluation Frameworks
Once prompts are versioned, every new version needs a quality score before it can be promoted to production, and scoring LLM output turns out to be its own challenge.
Evaluating an LLM's output is fundamentally harder than evaluating a classifier's predictions. A classifier produces a label; you compare it to the ground truth. An LLM produces free-form text; "correctness" depends on factual accuracy, coherence, relevance, completeness, tone, and a dozen other dimensions that resist simple metrics. Three evaluation paradigms have emerged, each with different tradeoffs between cost, speed, and reliability.
Evaluation Tiers: Speed vs. Depth
Automated scoring uses programmatic checks: does the output contain required fields? Does it parse as valid JSON? Does it match a regex pattern? These checks are fast, cheap, and deterministic, but they only capture surface-level quality.
LLM-as-judge uses a second LLM to evaluate the first LLM's output. The judge receives the input, the output, and a rubric (a scoring guide that defines what each quality level looks like for a given criterion), then scores the output on multiple dimensions. This approach captures semantic quality (coherence, factual accuracy, relevance) that automated checks miss. The tradeoff is cost (every evaluation requires an additional LLM call) and potential judge bias.
Human evaluation remains the gold standard for subjective quality and is essential for calibrating automated methods, but it is slow and expensive. A practical strategy combines all three: automated checks as a fast filter, LLM-as-judge for semantic quality, and periodic human evaluation to calibrate the judge.
"""
A multi-tier LLM evaluation framework combining automated checks,
LLM-as-judge scoring, and aggregation across test cases.
"""
from dataclasses import dataclass
from typing import Callable
from anthropic import Anthropic
import json
import re

@dataclass
class EvalCase:
    """A single evaluation test case."""
    input_text: str
    expected_output: str | None = None  # For reference-based eval
    metadata: dict = None

@dataclass
class EvalResult:
    """Result of evaluating one case across all criteria."""
    case: EvalCase
    scores: dict[str, float]      # criterion -> score (0-1)
    explanations: dict[str, str]  # criterion -> judge reasoning
    automated_checks: dict[str, bool]
    total_score: float = 0.0

    def __post_init__(self):
        if self.scores:
            self.total_score = sum(self.scores.values()) / len(self.scores)


class LLMEvaluator:
    """Multi-tier evaluation: automated checks + LLM-as-judge."""

    def __init__(self, judge_model: str = "claude-sonnet-4-20250514"):
        self.client = Anthropic()
        self.judge_model = judge_model
        self.automated_checks: list[tuple[str, Callable]] = []
        self.judge_criteria: list[dict] = []

    def add_automated_check(self, name: str,
                            check_fn: Callable[[str, EvalCase], bool]):
        """Add a programmatic quality check."""
        self.automated_checks.append((name, check_fn))

    def add_judge_criterion(self, name: str, description: str,
                            rubric: str):
        """Add a criterion for LLM-as-judge evaluation."""
        self.judge_criteria.append({
            "name": name,
            "description": description,
            "rubric": rubric
        })

    def _run_automated_checks(self, output: str,
                               case: EvalCase) -> dict[str, bool]:
        """Run all automated checks on an output."""
        return {
            name: check_fn(output, case)
            for name, check_fn in self.automated_checks
        }

    def _run_judge(self, input_text: str, output: str,
                   case: EvalCase) -> tuple[dict, dict]:
        """Run LLM-as-judge evaluation across all criteria."""
        criteria_text = "\n".join(
            f"- **{c['name']}**: {c['description']}\n"
            f"  Rubric: {c['rubric']}"
            for c in self.judge_criteria
        )

        judge_prompt = f"""You are an expert evaluator. Score the following
LLM output on each criterion using a scale from 0.0 to 1.0.

**Input given to the LLM:**
{input_text}

**LLM Output:**
{output}

**Evaluation Criteria:**
{criteria_text}

Respond in JSON format:
{{
  "scores": {{"criterion_name": score, ...}},
  "explanations": {{"criterion_name": "one-sentence reasoning", ...}}
}}"""

        response = self.client.messages.create(
            model=self.judge_model,
            max_tokens=1000,
            temperature=0.0,  # Deterministic judging
            messages=[{"role": "user", "content": judge_prompt}]
        )

        # Parse the judge's response
        text = response.content[0].text
        # Extract JSON from response
        json_match = re.search(r'\{.*\}', text, re.DOTALL)
        if json_match:
            result = json.loads(json_match.group())
            return result.get("scores", {}), result.get("explanations", {})
        return {}, {}

    def evaluate(self, output: str, case: EvalCase) -> EvalResult:
        """Run full evaluation pipeline on a single case."""
        # Tier 1: Automated checks
        auto_results = self._run_automated_checks(output, case)

        # Tier 2: LLM-as-judge (skip if automated checks fail badly)
        all_auto_pass = all(auto_results.values())
        if all_auto_pass and self.judge_criteria:
            scores, explanations = self._run_judge(
                case.input_text, output, case
            )
        else:
            scores = {c["name"]: 0.0 for c in self.judge_criteria}
            explanations = {c["name"]: "Skipped: automated checks failed"
                          for c in self.judge_criteria}

        return EvalResult(
            case=case,
            scores=scores,
            explanations=explanations,
            automated_checks=auto_results
        )

    def evaluate_batch(self, outputs: list[str],
                       cases: list[EvalCase]) -> dict:
        """Evaluate a batch and compute aggregate statistics."""
        results = [
            self.evaluate(output, case)
            for output, case in zip(outputs, cases)
        ]

        # Aggregate scores across all cases
        all_criteria = set()
        for r in results:
            all_criteria.update(r.scores.keys())

        aggregated = {}
        for criterion in all_criteria:
            scores = [r.scores.get(criterion, 0) for r in results]
            aggregated[criterion] = {
                "mean": sum(scores) / len(scores),
                "min": min(scores),
                "max": max(scores),
                "below_threshold": sum(1 for s in scores if s < 0.7)
            }

        return {
            "n_cases": len(results),
            "overall_mean": sum(r.total_score for r in results) / len(results),
            "criteria": aggregated,
            "auto_check_pass_rate": {
                name: sum(1 for r in results if r.automated_checks.get(name, False)) / len(results)
                for name in dict(self.automated_checks)
            },
            "results": results
        }


# Configure an evaluator for scientific paper summarization
evaluator = LLMEvaluator()

# Automated checks (fast, cheap)
evaluator.add_automated_check(
    "has_hypothesis",
    lambda output, case: "hypothesis" in output.lower()
        or "claim" in output.lower()
)
evaluator.add_automated_check(
    "length_ok",
    lambda output, case: 50 < len(output.split()) < 200
)
evaluator.add_automated_check(
    "no_hallucinated_citations",
    lambda output, case: "et al." not in output  # No invented refs
)

# LLM-as-judge criteria (slower, captures semantics)
evaluator.add_judge_criterion(
    "factual_accuracy",
    "Does the summary accurately represent the paper's claims?",
    "1.0 = perfectly accurate, 0.5 = mostly accurate with minor errors, "
    "0.0 = contains fabricated claims"
)
evaluator.add_judge_criterion(
    "completeness",
    "Does the summary cover hypothesis, method, and results?",
    "1.0 = all three present, 0.7 = two of three, 0.3 = one of three"
)
evaluator.add_judge_criterion(
    "conciseness",
    "Is the summary appropriately concise without losing key information?",
    "1.0 = perfectly concise, 0.5 = somewhat verbose, 0.0 = rambling"
)A research team builds an agent that reads papers from PubMed and generates structured summaries for a literature mining pipeline. They set up the evaluator above with 50 test cases (papers with human-written reference summaries). Prompt v1 scores 0.72 on factual accuracy, 0.68 on completeness, and 0.85 on conciseness. They modify the prompt to include explicit section headers ("Hypothesis:", "Method:", "Results:") and re-evaluate: factual accuracy rises to 0.81, completeness jumps to 0.89, and conciseness holds at 0.83. The structured format guides the model to cover all sections, improving completeness by 21 percentage points. They register prompt v2 as the new active version, keeping v1 available for rollback. The entire evaluation runs automatically on each prompt change, catching regressions before they reach production.
3. Cost Optimization and Token Budgeting
LLM API calls cost money, and agent workflows multiply that cost. A single user query that triggers five LLM calls, each with 4,000 input tokens and 1,000 output tokens, accumulates costs rapidly at scale. Cost optimization requires tracking token usage per call, per agent step, and per user request, then applying strategies to reduce spend without degrading quality.
The cost of an LLM API call is:
$$C = \frac{n_{\text{input}} \cdot p_{\text{input}} + n_{\text{output}} \cdot p_{\text{output}}}{1{,}000{,}000}$$where \(n_{\text{input}}\) and \(n_{\text{output}}\) are token counts and \(p_{\text{input}}\), \(p_{\text{output}}\) are per-million-token prices. With Claude Sonnet at roughly \$3/\$15 per million input/output tokens (circa 2025), a 5-step agent chain processing 20K input tokens per step costs about $0.30 per user request before accounting for output tokens. At 10,000 requests per day, that is \$3,000 daily, meaning a five-step agent chain can cost more per month than the engineer who built it.
"""
Token cost tracking and budget enforcement for LLM applications.
"""
from dataclasses import dataclass, field
from datetime import datetime, timedelta
from collections import defaultdict

@dataclass
class TokenUsage:
    """Token usage record for a single LLM call."""
    model: str
    input_tokens: int
    output_tokens: int
    cached_input_tokens: int = 0  # Prompt caching savings
    timestamp: str = field(
        default_factory=lambda: datetime.now().isoformat()
    )
    trace_id: str = ""  # Links to agent trace
    step_name: str = ""  # Which agent step

    @property
    def cost(self) -> float:
        """Compute cost based on model pricing."""
        pricing = {
            # (input_per_million, output_per_million, cache_per_million)
            # Prices as of early 2025; check the provider's pricing page
            "claude-sonnet-4-20250514": (3.0, 15.0, 0.30),
            "claude-haiku-35-20241022": (0.80, 4.0, 0.08),
            "claude-opus-4-20250514": (15.0, 75.0, 1.50),
        }
        p_in, p_out, p_cache = pricing.get(
            self.model, (3.0, 15.0, 0.30)
        )
        billable_input = self.input_tokens - self.cached_input_tokens
        return (
            billable_input * p_in
            + self.output_tokens * p_out
            + self.cached_input_tokens * p_cache
        ) / 1_000_000


class CostTracker:
    """Track and enforce token budgets across an application."""

    def __init__(self, daily_budget: float = 100.0):
        self.daily_budget = daily_budget
        self.records: list[TokenUsage] = []
        self._by_trace: dict[str, list[TokenUsage]] = defaultdict(list)
        self._by_step: dict[str, list[TokenUsage]] = defaultdict(list)

    def record(self, usage: TokenUsage) -> None:
        """Record a token usage event."""
        self.records.append(usage)
        if usage.trace_id:
            self._by_trace[usage.trace_id].append(usage)
        if usage.step_name:
            self._by_step[usage.step_name].append(usage)

    def daily_spend(self) -> float:
        """Total spend for the current day."""
        today = datetime.now().date().isoformat()
        return sum(
            r.cost for r in self.records
            if r.timestamp.startswith(today)
        )

    def check_budget(self) -> dict:
        """Check budget status and return warnings."""
        spent = self.daily_spend()
        remaining = self.daily_budget - spent
        utilization = spent / self.daily_budget if self.daily_budget else 0

        return {
            "daily_budget": self.daily_budget,
            "spent_today": round(spent, 4),
            "remaining": round(remaining, 4),
            "utilization": round(utilization, 3),
            "warning": utilization > 0.8,
            "exceeded": utilization > 1.0
        }

    def cost_by_trace(self, trace_id: str) -> dict:
        """Break down cost for a single agent execution."""
        records = self._by_trace[trace_id]
        return {
            "total_cost": sum(r.cost for r in records),
            "n_calls": len(records),
            "by_step": {
                step: sum(r.cost for r in records if r.step_name == step)
                for step in set(r.step_name for r in records)
            },
            "total_input_tokens": sum(r.input_tokens for r in records),
            "total_output_tokens": sum(r.output_tokens for r in records),
            "cache_savings": sum(
                r.cached_input_tokens
                * (3.0 - 0.30) / 1_000_000  # Savings vs. uncached
                for r in records
            )
        }

    def optimization_report(self) -> dict:
        """Identify cost optimization opportunities."""
        step_costs = {}
        for step, records in self._by_step.items():
            total = sum(r.cost for r in records)
            avg_input = sum(r.input_tokens for r in records) / len(records)
            cache_rate = (
                sum(r.cached_input_tokens for r in records)
                / max(sum(r.input_tokens for r in records), 1)
            )
            step_costs[step] = {
                "total_cost": round(total, 4),
                "n_calls": len(records),
                "avg_input_tokens": int(avg_input),
                "cache_hit_rate": round(cache_rate, 3),
                "recommendation": (
                    "Enable prompt caching" if cache_rate < 0.3
                    and avg_input > 2000
                    else "Consider smaller model" if avg_input < 500
                    else "Well optimized"
                )
            }

        return {
            "total_spend": sum(r.cost for r in self.records),
            "by_step": step_costs,
            "top_spenders": sorted(
                step_costs.items(),
                key=lambda x: x[1]["total_cost"],
                reverse=True
            )[:5]
}The most effective cost optimization is often the simplest: use a smaller model. Claude Haiku typically handles classification, extraction, and formatting tasks at one-quarter the cost of Sonnet, often with minimal quality loss on those narrower tasks. A common pattern is to route easy requests to Haiku and hard requests to Sonnet, using a lightweight classifier (or Haiku itself) to make the routing decision. This "model cascade" (a tiered routing strategy that sends simple queries to a cheaper model and escalates complex queries to a more capable one) approach can, depending on the workload mix, reduce costs by 60-70% when a large share of requests are simple enough for the smaller model.
4. Agent Trace Logging
Controlling costs requires knowing where tokens go, and for multi-step agents that chain dozens of LLM calls and tool invocations, answering that question demands a complete execution trace.
An agent is not a single LLM call. It is a tree of decisions: the planner selects a tool, the tool returns a result, the planner interprets the result, selects another tool, and so on until the task is complete (or the budget runs out, or the agent loops forever). Debugging an agent failure requires reconstructing this entire decision tree, which means every step must be logged with its inputs, outputs, timing, and cost. This is trace logging, and it is the observability backbone of AgentOps. Figure 22.2.1 illustrates agent trace execution tree with hierarchical spans.
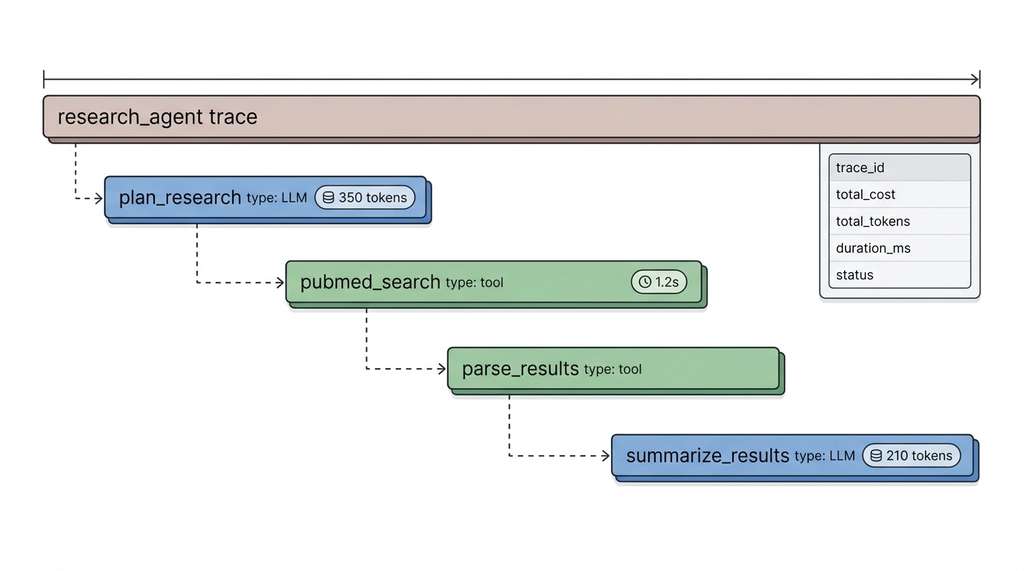
A trace captures the complete execution from user request to final response as a hierarchy of spans. Each span represents one operation (an LLM call, a tool invocation, a retrieval query), and spans nest to mirror the agent's decision tree.
"""
Agent trace logging: capturing the full execution tree
of an agent pipeline for debugging and analysis.
"""
from dataclasses import dataclass, field
from datetime import datetime
from typing import Any
import uuid
import time
import json

@dataclass
class Span:
    """A single operation in an agent trace."""
    span_id: str = field(default_factory=lambda: str(uuid.uuid4())[:8])
    parent_id: str | None = None
    name: str = ""
    span_type: str = "generic"  # "llm", "tool", "retrieval", "chain"
    start_time: float = 0.0
    end_time: float = 0.0
    inputs: dict = field(default_factory=dict)
    outputs: dict = field(default_factory=dict)
    metadata: dict = field(default_factory=dict)
    error: str | None = None
    token_usage: dict = field(default_factory=dict)

    @property
    def duration_ms(self) -> float:
        return (self.end_time - self.start_time) * 1000

    @property
    def status(self) -> str:
        if self.error:
            return "error"
        if self.end_time > 0:
            return "completed"
        return "running"


class AgentTracer:
    """Hierarchical trace logger for agent executions."""

    def __init__(self):
        self.traces: dict[str, dict] = {}
        self._active_spans: dict[str, Span] = {}

    def start_trace(self, name: str, user_input: str) -> str:
        """Begin a new trace for an agent execution."""
        trace_id = str(uuid.uuid4())[:12]
        self.traces[trace_id] = {
            "trace_id": trace_id,
            "name": name,
            "user_input": user_input,
            "start_time": time.time(),
            "spans": [],
            "total_cost": 0.0,
            "status": "running"
        }
        return trace_id

    def start_span(self, trace_id: str, name: str,
                   span_type: str = "generic",
                   parent_id: str | None = None,
                   inputs: dict | None = None) -> str:
        """Start a new span within a trace."""
        span = Span(
            name=name,
            span_type=span_type,
            parent_id=parent_id,
            start_time=time.time(),
            inputs=inputs or {}
        )
        self._active_spans[span.span_id] = span
        self.traces[trace_id]["spans"].append(span)
        return span.span_id

    def end_span(self, span_id: str,
                 outputs: dict | None = None,
                 token_usage: dict | None = None,
                 error: str | None = None) -> None:
        """Complete a span with its outputs."""
        span = self._active_spans.get(span_id)
        if span:
            span.end_time = time.time()
            span.outputs = outputs or {}
            span.token_usage = token_usage or {}
            span.error = error
            del self._active_spans[span_id]

    def end_trace(self, trace_id: str,
                  final_output: str = "") -> dict:
        """Complete a trace and compute summary statistics."""
        trace = self.traces[trace_id]
        trace["end_time"] = time.time()
        trace["duration_ms"] = (
            (trace["end_time"] - trace["start_time"]) * 1000
        )
        trace["final_output"] = final_output
        trace["status"] = "completed"

        # Compute aggregated statistics
        spans = trace["spans"]
        trace["stats"] = {
            "total_spans": len(spans),
            "llm_calls": sum(
                1 for s in spans if s.span_type == "llm"
            ),
            "tool_calls": sum(
                1 for s in spans if s.span_type == "tool"
            ),
            "errors": sum(1 for s in spans if s.error),
            "total_llm_latency_ms": sum(
                s.duration_ms for s in spans if s.span_type == "llm"
            ),
            "total_tool_latency_ms": sum(
                s.duration_ms for s in spans if s.span_type == "tool"
            ),
            "total_input_tokens": sum(
                s.token_usage.get("input_tokens", 0) for s in spans
            ),
            "total_output_tokens": sum(
                s.token_usage.get("output_tokens", 0) for s in spans
            ),
        }
        return trace

    def detect_loops(self, trace_id: str,
                     max_repeats: int = 3) -> list[str]:
        """Detect repeated tool calls that suggest agent is stuck."""
        spans = self.traces[trace_id]["spans"]
        tool_sequence = [
            (s.name, json.dumps(s.inputs, sort_keys=True))
            for s in spans if s.span_type == "tool"
        ]

        # Find repeated subsequences
        loops = []
        for i in range(len(tool_sequence)):
            count = 1
            for j in range(i + 1, len(tool_sequence)):
                if tool_sequence[j] == tool_sequence[i]:
                    count += 1
            if count >= max_repeats:
                loops.append(
                    f"Tool '{tool_sequence[i][0]}' called "
                    f"{count} times with same inputs"
                )
        return loops


# Example: tracing a research agent execution
tracer = AgentTracer()
trace_id = tracer.start_trace(
    "research_agent",
    "Find recent papers on protein folding with AlphaFold"
)

# Span 1: Planning LLM call
plan_span = tracer.start_span(
    trace_id, "plan_research", "llm",
    inputs={"prompt": "Plan search strategy for protein folding..."}
)
tracer.end_span(plan_span, outputs={"plan": "Search PubMed, then ArXiv"},
                token_usage={"input_tokens": 500, "output_tokens": 100})

# Span 2: Tool call (search)
search_span = tracer.start_span(
    trace_id, "pubmed_search", "tool",
    inputs={"query": "AlphaFold protein folding 2024"}
)
tracer.end_span(search_span,
                outputs={"n_results": 25, "top_result": "PMID:39001234"})

# Span 3: Summarization LLM call
summary_span = tracer.start_span(
    trace_id, "summarize_results", "llm",
    inputs={"n_papers": 25}
)
tracer.end_span(summary_span,
                outputs={"summary": "Found 25 papers..."},
                token_usage={"input_tokens": 8000, "output_tokens": 500})

# Complete the trace
trace = tracer.end_trace(trace_id, "Found 25 papers on AlphaFold...")Checkpoint
So far: prompts are versioned in a registry (Section 1), evaluated with a multi-tier framework before promotion (Section 2), tracked for token cost and budget compliance (Section 3), and now every agent execution is recorded as a hierarchical trace of spans that captures inputs, outputs, timing, and cost per step (Section 4). The remaining sections build on these traces to detect failing tools and connect everything to production observability platforms.
5. Tool-Call Monitoring and Circuit Breakers
An agent's tools are external dependencies: API calls, database queries, file system operations, web searches. Each tool can fail (timeout, rate limit, server error), and tool failures cascade through the agent's decision tree. A web search that times out causes the agent to retry. The retry costs more tokens, which may exceed the budget and fail the entire task. Tool-call monitoring tracks reliability, latency, and error rates for each tool, typically measured over a rolling window (a fixed-size buffer of recent results that discards the oldest entry as each new one arrives) so that metrics reflect current conditions rather than lifetime averages. Circuit breakers prevent cascading failures by temporarily disabling tools that consistently fail.
Mental Model
Think of a circuit breaker like the safety valve on a home water heater. Under normal conditions the valve stays closed and water flows through the system. If pressure builds dangerously (analogous to a tool's failure rate crossing a threshold), the valve pops open and diverts flow, preventing the tank from rupturing (preventing the agent from burning through its entire token budget on futile retries). After the pressure drops (the recovery timeout elapses), the valve allows a small test flow (the half-open state) to check whether the system has stabilized before returning to full operation. The key mechanism is the same in both cases: automatic, threshold-triggered interruption that protects the whole system from one failing component, with a built-in test-and-restore cycle.
"""
Tool reliability monitoring with circuit breakers.
Prevents cascading failures in agent tool chains.
"""
from dataclasses import dataclass, field
from enum import Enum
from collections import deque
import time

class CircuitState(Enum):
    CLOSED = "closed"      # Normal operation
    OPEN = "open"          # Tool disabled, failing fast
    HALF_OPEN = "half_open"  # Testing if tool recovered

@dataclass
class ToolMetrics:
    """Rolling window metrics for a single tool."""
    name: str
    window_size: int = 100
    failure_threshold: float = 0.5  # Open circuit at 50% failure
    recovery_timeout: float = 60.0  # Seconds before half-open

    # Internal state
    results: deque = field(default_factory=lambda: deque(maxlen=100))
    latencies: deque = field(default_factory=lambda: deque(maxlen=100))
    state: CircuitState = CircuitState.CLOSED
    last_failure_time: float = 0.0
    consecutive_successes: int = 0

    @property
    def failure_rate(self) -> float:
        if not self.results:
            return 0.0
        return sum(1 for r in self.results if not r) / len(self.results)

    @property
    def avg_latency_ms(self) -> float:
        if not self.latencies:
            return 0.0
        return sum(self.latencies) / len(self.latencies)

    @property
    def p95_latency_ms(self) -> float:
        if not self.latencies:
            return 0.0
        sorted_lat = sorted(self.latencies)
        idx = int(len(sorted_lat) * 0.95)
        return sorted_lat[min(idx, len(sorted_lat) - 1)]


class ToolMonitor:
    """Monitor tool reliability and enforce circuit breakers."""

    def __init__(self):
        self.tools: dict[str, ToolMetrics] = {}

    def register_tool(self, name: str,
                      failure_threshold: float = 0.5,
                      recovery_timeout: float = 60.0) -> None:
        """Register a tool for monitoring."""
        self.tools[name] = ToolMetrics(
            name=name,
            failure_threshold=failure_threshold,
            recovery_timeout=recovery_timeout
        )

    def can_call(self, name: str) -> tuple[bool, str]:
        """Check if a tool is available (circuit breaker check)."""
        metrics = self.tools.get(name)
        if not metrics:
            return True, "unmonitored"

        if metrics.state == CircuitState.CLOSED:
            return True, "ok"

        if metrics.state == CircuitState.OPEN:
            # Check if recovery timeout has elapsed
            elapsed = time.time() - metrics.last_failure_time
            if elapsed >= metrics.recovery_timeout:
                metrics.state = CircuitState.HALF_OPEN
                metrics.consecutive_successes = 0
                return True, "testing_recovery"
            return False, (
                f"circuit_open: {metrics.failure_rate:.0%} failure rate, "
                f"retry in {metrics.recovery_timeout - elapsed:.0f}s"
            )

        # HALF_OPEN: allow one call to test recovery
        return True, "half_open_test"

    def record_result(self, name: str, success: bool,
                      latency_ms: float) -> None:
        """Record the outcome of a tool call."""
        metrics = self.tools.get(name)
        if not metrics:
            return

        metrics.results.append(success)
        metrics.latencies.append(latency_ms)

        if not success:
            metrics.last_failure_time = time.time()
            metrics.consecutive_successes = 0

            # Check if we should open the circuit
            if (metrics.state == CircuitState.CLOSED
                    and metrics.failure_rate >= metrics.failure_threshold
                    and len(metrics.results) >= 10):
                metrics.state = CircuitState.OPEN

            # Half-open test failed: reopen
            elif metrics.state == CircuitState.HALF_OPEN:
                metrics.state = CircuitState.OPEN

        else:
            metrics.consecutive_successes += 1

            # Half-open: close circuit after 3 consecutive successes
            if (metrics.state == CircuitState.HALF_OPEN
                    and metrics.consecutive_successes >= 3):
                metrics.state = CircuitState.CLOSED

    def dashboard(self) -> dict:
        """Generate a monitoring dashboard summary."""
        return {
            name: {
                "state": m.state.value,
                "failure_rate": round(m.failure_rate, 3),
                "avg_latency_ms": round(m.avg_latency_ms, 1),
                "p95_latency_ms": round(m.p95_latency_ms, 1),
                "total_calls": len(m.results),
            }
            for name, m in self.tools.items()
        }


# Set up monitoring for a research agent's tools
monitor = ToolMonitor()
monitor.register_tool("pubmed_search", failure_threshold=0.3,
                      recovery_timeout=120.0)
monitor.register_tool("arxiv_search", failure_threshold=0.3,
                      recovery_timeout=120.0)
monitor.register_tool("web_scraper", failure_threshold=0.5,
                      recovery_timeout=60.0)
monitor.register_tool("llm_summarize", failure_threshold=0.2,
recovery_timeout=30.0)Step-Through: Circuit Breaker State Transitions
Trace the circuit breaker for pubmed_search (failure threshold 0.3, recovery
timeout 120s) through this sequence of ten tool calls, tracking the state and failure rate
after each call:
Call 1: success. Results window: [True]. Failure rate: 0/1 = 0.0. State: CLOSED.
Call 2: success. Results: [True, True]. Failure rate: 0/2 = 0.0. State: CLOSED.
Call 3: failure. Results: [True, True, False]. Failure rate: 1/3 = 0.33. State: CLOSED (window has fewer than 10 entries, so the threshold check does not trigger).
Calls 4 through 9: alternating failure, success, failure, success, failure, failure. Results: [T, T, F, F, T, F, T, F, F]. Failure rate: 5/9 = 0.56. State: CLOSED (still below 10 entries).
Call 10: failure. Results: [T, T, F, F, T, F, T, F, F, F]. Failure rate: 6/10 = 0.60, which exceeds the 0.3 threshold, and the window now has 10 entries. State transitions to OPEN.
After 120 seconds: the next can_call check finds the recovery timeout elapsed. State transitions to HALF_OPEN. One test call is allowed.
Test call: success. consecutive_successes = 1. State stays HALF_OPEN (needs 3).
Two more successes: consecutive_successes reaches 3. State transitions back to CLOSED.
A model failure is usually a wrong prediction: the output is incorrect but the system continues operating. An agent failure is often a cascading collapse: a tool times out, the agent retries, the retry fails, the agent tries an alternative tool that also fails, and the whole chain burns through tokens while producing nothing useful. Circuit breakers prevent this cascade by fast-failing on unreliable tools, forcing the agent to skip the failing step or report an honest "I could not complete this task" instead of consuming budget on futile retries. This operational pattern becomes essential for the autonomous systems in Chapter 53.
6. Production Observability with LangSmith and Arize Phoenix
The custom AgentTracer and ToolMonitor above demonstrate how tracing and circuit breakers work internally; production systems replace these hand-built components with dedicated observability platforms that provide the same capabilities out of the box, plus visualization, alerting, and team collaboration.
LangSmith (by LangChain)
and Arize Phoenix
(open-source) provide trace visualization, evaluation dashboards, cost tracking, and
alerting out of the box. As of 2025, Langfuse has emerged as another widely adopted open-source LLM observability platform, offering prompt management, tracing, and evaluation with a self-hostable architecture; and Helicone provides a lightweight proxy-based approach to cost and latency monitoring that requires no SDK integration.
"""
Instrumenting an agent with OpenTelemetry-compatible tracing
for Arize Phoenix (open-source LLM observability).
"""
# Phoenix uses OpenInference, an OpenTelemetry-based standard
# for LLM application tracing.

from openinference.instrumentation import using_attributes
from openinference.semconv.trace import SpanAttributes
from opentelemetry import trace as otel_trace
from opentelemetry.sdk.trace import TracerProvider
from opentelemetry.sdk.trace.export import SimpleSpanProcessor

# In production, export to Phoenix or another OTLP collector.
# OTLP (OpenTelemetry Protocol) is the standard wire format
# for exporting telemetry data to observability backends.
# from openinference.instrumentation.openai import OpenAIInstrumentor
# from phoenix.otel import register
# tracer_provider = register(endpoint="http://localhost:6006/v1/traces")

def instrument_anthropic_calls():
    """
    Phoenix auto-instruments Anthropic SDK calls when you
    install openinference-instrumentation-anthropic.

    pip install openinference-instrumentation-anthropic arize-phoenix

    After instrumentation, every Anthropic API call
    automatically emits spans with:
    - Input/output messages
    - Token counts
    - Model name and parameters
    - Latency
    - Cost (computed from token counts)
    """
    from openinference.instrumentation.anthropic import (
        AnthropicInstrumentor
    )
    AnthropicInstrumentor().instrument()
    # All subsequent Anthropic calls are now traced


def instrument_langchain_agent():
    """
    LangSmith integration for LangChain-based agents.
    Set LANGSMITH_API_KEY and LANGSMITH_TRACING=true
    in environment variables for automatic tracing.
    """
    import os
    os.environ["LANGSMITH_TRACING"] = "true"
    # os.environ["LANGSMITH_API_KEY"] = "your-key-here"
    os.environ["LANGSMITH_PROJECT"] = "discovery-research-agent"

    # Every LangChain call now emits traces to LangSmith
    # with full input/output capture, token usage, and timing.
    # The LangSmith UI provides:
    # - Trace waterfall visualization
    # - Token usage and cost breakdown per step
    # - Evaluation dataset management
    # - A/B comparison of prompt versions
    # - Feedback collection for reinforcement learning from human feedback (RLHF)


def phoenix_evaluation_example():
    """
    Phoenix evaluation: run LLM-as-judge evaluations
    on traced data, stored alongside the traces.
    """
    # After collecting traces in Phoenix:
    # 1. Export a dataset of (input, output) pairs
    # 2. Run evaluations with built-in or custom evaluators
    # 3. View evaluation scores alongside traces in the UI

    # Phoenix provides built-in evaluators:
    # - Relevance: Is the response relevant to the query?
    # - Hallucination: Does the response contain unsupported claims?
    # - Toxicity: Is the response harmful or offensive?
    # - QA correctness: Does the answer match the reference?

    from phoenix.evals import (
        HallucinationEvaluator,
        RelevanceEvaluator,
        run_evals,
    )
    from phoenix.evals.models import AnthropicModel

    eval_model = AnthropicModel(model="claude-sonnet-4-20250514")
    hallucination_eval = HallucinationEvaluator(eval_model)
    relevance_eval = RelevanceEvaluator(eval_model)

    # run_evals runs evaluators on exported trace data
    # Results appear in the Phoenix UI alongside the original traces
Our custom AgentTracer and ToolMonitor total about 200 lines
and handle the core tracing and monitoring logic. Arize Phoenix replaces this with
auto-instrumentation (one line to enable), a web-based trace viewer with waterfall
visualization, built-in evaluators, and OpenTelemetry (an open-source observability framework that standardizes the collection and export of traces, metrics, and logs across distributed systems) export. LangSmith adds managed
hosting, team collaboration, evaluation dataset management, and prompt playground features.
Both platforms reduce the observability implementation from hundreds of lines to
environment variable configuration, letting you focus on the evaluation criteria and
monitoring thresholds rather than the tracing plumbing.
Real-World Application: Spotify's LLM Evaluation at Scale
Spotify has reportedly adopted a multi-tier LLM evaluation pipeline for its AI DJ and podcast summarization features. Automated checks verify structural constraints (valid JSON, required fields present, output length within bounds), while an LLM-as-judge layer scores relevance and factual grounding against the source audio transcript. Prompt versions are registered in an internal prompt registry and promoted through staging environments only after passing evaluation thresholds on a curated test suite of several hundred cases, ensuring that a prompt change for one locale does not degrade quality in another.
Research Frontier
Current AgentOps tools observe and report. The research frontier is closing the loop: agents that analyze their own execution traces to improve future performance. AgentTrek (Wang et al., 2024) introduced a framework for automatically generating expert-quality agent training trajectories from web task traces, enabling LLM agents to learn from their own execution histories at scale. Building on this direction, the AgentOps ecosystem has converged around OpenTelemetry-based standards such as OpenInference (used by Arize Phoenix) and the OpenLLMetry project (Traceloop, 2024), which define semantic conventions for LLM spans so that traces are portable across observability backends. These standards make it practical to collect, aggregate, and mine execution traces across heterogeneous agent deployments, providing the raw material for reinforcement learning from execution feedback (RLEF), where an agent's own traced successes and failures serve as training signal to improve its future decisions. The trace infrastructure built in this section provides the foundation for these self-improvement loops, connecting to the autonomous software organizations of Chapter 24, where agent teams must continuously improve their own operational processes.
Try It: Build a Prompt A/B Testing Pipeline
Step 1. Create two prompt versions for a simple task (for example, "extract the three most important keywords from a paragraph"). Version A uses a bare instruction; version B adds a role prefix ("You are an expert information retrieval specialist") and an output format constraint ("Return a JSON array of exactly three strings").
Step 2. Collect 10 short text paragraphs from Wikipedia or any public source and store them in a list. These are your evaluation test cases.
Step 3. Using the Anthropic Python SDK (pip install anthropic), write a script that sends each paragraph to both prompt versions and records the responses along with token usage from the API response's usage field.
Step 4. Implement two automated checks per response: (a) does the output parse as valid JSON? (b) does the parsed list contain exactly three items? Compute the pass rate for each prompt version across all 10 cases.
Step 5. Print a comparison table showing, for each version: JSON parse pass rate, three-item pass rate, average input tokens, average output tokens, and estimated cost. Determine which version is more reliable and more cost-efficient, and note how a single formatting instruction in the prompt changes both quality and token consumption.
Exercise 22.2.1
You have a prompt registry with two versions of a paper_summarizer prompt.
Version 1 uses temperature=0.3 and max_tokens=500; version 2
uses temperature=0.2 and max_tokens=600. You evaluate both on
50 test cases. Version 1 scores 0.72 mean factual accuracy; version 2 scores 0.81. You
activate version 2. The next morning, the team reports that summaries are now truncated.
What is the most likely cause, and how would the PromptRegistry.diff() method
help you diagnose it?
Hint
Look at what diff() returns: it reports whether the template, model, or
parameters changed between two versions. The truncation is not caused by max_tokens
(which increased from 500 to 600). Consider what happens when you lower temperature: the
model becomes more deterministic and may stop generating earlier if the most probable next
token is the end-of-sequence token. The diff() output showing
params_changed: True alongside both versions' evaluation scores would lead
you to compare the temperature setting and re-evaluate whether the lower temperature
causes premature stopping on longer papers.
Exercises
- (Conceptual) Compare the operational challenges of MLOps, LLMOps, and AgentOps along three dimensions: what artifacts need versioning, what metrics define "quality," and what failure modes require monitoring. Create a comparison table.
-
(Coding) Extend the
LLMEvaluatorto support reference-based evaluation using Recall-Oriented Understudy for Gisting Evaluation (ROUGE) scores (from therouge-scorelibrary) as an additional automated check tier. Run it on 10 paper summaries and compare ROUGE scores to the LLM-as-judge scores. How well do they correlate? -
(Analysis) Instrument a simple two-step agent (search + summarize) with
the
AgentTracerandCostTracker. Run it on 20 queries and analyze the traces. What fraction of the total cost comes from the search step versus the summarization step? What is the median end-to-end latency? Identify one optimization that would reduce cost by at least 30%.
Lab: Prompt Version Showdown with Live Cost Tracking
Goal: Measure how prompt wording affects both output quality and token cost
on a real evaluation suite, using the Anthropic Python SDK.
Tools needed: Python 3.10+, pip install anthropic, a free-tier
Anthropic API key.
Setup (5 min): Write three prompt versions for the task "extract the top three
keywords from a paragraph": (A) a bare one-line instruction, (B) the same instruction plus a
role prefix ("You are an expert information retrieval specialist"), (C) version B plus an
explicit output format constraint ("Return a JSON array of exactly three strings, no other
text").
Experiment (15 min): Collect 10 short paragraphs (Wikipedia lead sections work
well). For each paragraph, call client.messages.create() with all three prompt
versions using claude-haiku-35-20241022. Record the response text and the
response.usage.input_tokens and response.usage.output_tokens values.
Compute cost per call using Haiku pricing (\$0.80 / \$4.00 per million input/output tokens, circa 2025).
What to vary: Try the same three prompts with claude-sonnet-4-20250514
and compare quality and cost across models.
What to observe: For each version, compute (1) JSON parse success rate, (2)
fraction of responses with exactly three items, (3) average output tokens, (4) total cost
across all 10 cases. You should see that version C dramatically improves structural compliance
while version B has minimal effect on its own, and that the Haiku/Sonnet cost gap is roughly
4x for nearly identical structural compliance on this simple extraction task.