Prerequisites
This section builds on the five quality axes from Section 56.1 and the agent evaluation methodology from Chapter 23, which introduced SWE-bench and the concepts of pass@k scoring and agent scaffolding.
Benchmarks are the rulers by which we measure AI capabilities. A good ruler is calibrated, durable, and measures what we care about. A bad ruler gives precise readings of the wrong quantity. Six major benchmarks collectively span the evaluation landscape for scientific discovery AI. Examining what each measures through the lens of the five quality axes reveals both their reach and the gaps that remain unbenchmarked. We also introduce the concept of saturation: the point at which a benchmark stops discriminating between improving systems and becomes a checkbox rather than a signal.
1. Anatomy of a Discovery Benchmark
In 2024, a leading AI lab reported that its model "achieved expert-level performance on graduate science questions," yet that same model could not design a single novel experiment when given an open-ended research prompt. The gap between benchmark scores and real discovery capability begins with understanding what benchmarks actually measure, and every benchmark consists of four components that determine exactly that.
Task bank: A collection of problems, each with a natural-language description of what the system should accomplish. Tasks range from "analyze this dataset and report the main finding" (open-ended) to "what is the binding affinity of molecule X to target Y?" (closed-form).
A task bank is the foundation of any benchmark: a curated set of problems defining what gets measured. Its composition directly determines which capabilities a benchmark detects and which it misses. A task bank skewed toward one domain or difficulty level produces misleading rankings. Each task pairs a natural-language prompt with structured metadata (domain, difficulty, expected output format). The benchmark harness feeds these tasks to the system under evaluation one at a time or in batches. Broad domain coverage and calibrated difficulty support fair system comparisons; a narrow, domain-specific task bank probes depth in a single field.
Gold standard: The expected output for each task, used for scoring. In closed-form benchmarks, this is a single correct answer. In open-ended benchmarks, it may be a rubric, a reference solution, or a set of acceptable outputs.
Scoring protocol: The function that maps (system output, gold standard) to a score. Common protocols include exact match, fuzzy match (approximate comparison that allows minor differences in formatting, whitespace, or numerical precision), pass@k (where pass@k is the probability that at least one of \(k\) independent attempts produces a correct solution), and medal-based scoring (bronze/silver/gold thresholds).
Checkpoint
So far: every benchmark consists of a task bank (the problems), a gold standard (the expected answers), and a scoring protocol (the function that compares output to gold standard and produces a number).
Scaffolding constraints: Rules about what tools, application programming interfaces (APIs), and resources the system may access during evaluation. Some benchmarks allow internet access; others restrict the system to local files. These constraints dramatically affect scores and must be reported alongside results. In short: A benchmark is only as trustworthy as its weakest component; a flawed gold standard or an under-specified scaffolding rule can quietly turn a leaderboard into a mirage.
from dataclasses import dataclass, field
from typing import List, Dict, Optional, Callable
from enum import Enum


class ScoringProtocol(Enum):
    EXACT_MATCH = "exact_match"
    FUZZY_MATCH = "fuzzy_match"
    PASS_AT_K = "pass_at_k"
    MEDAL_BASED = "medal_based"
    RUBRIC_SCORED = "rubric_scored"
    EXECUTION_BASED = "execution_based"


@dataclass
class BenchmarkTask:
    """A single task in a discovery benchmark."""
    task_id: str
    description: str
    domain: str  # e.g., "biology", "chemistry", "physics", "ml"
    gold_standard: Optional[str] = None
    gold_code: Optional[str] = None  # reference implementation
    difficulty: str = "medium"  # easy, medium, hard, expert
    metadata: Dict = field(default_factory=dict)


@dataclass
class BenchmarkSuite:
    """A complete benchmark with tasks, scoring, and metadata."""
    name: str
    version: str
    tasks: List[BenchmarkTask]
    scoring: ScoringProtocol
    allows_internet: bool = False
    allows_code_execution: bool = True
    max_attempts: int = 1
    time_limit_seconds: Optional[int] = None

    @property
    def n_tasks(self) -> int:
        return len(self.tasks)

    def domain_distribution(self) -> Dict[str, int]:
        """Count tasks by domain."""
        dist = {}
        for task in self.tasks:
            dist[task.domain] = dist.get(task.domain, 0) + 1
        return dist
2. ScienceAgentBench (NeurIPS 2024)
ScienceAgentBench (Chen et al., 2024) is the most targeted benchmark for evaluating end-to-end scientific discovery agents. It contains 102 tasks drawn from 44 peer-reviewed publications across four disciplines: bioinformatics, computational chemistry, geographical information science, and psychology. Each task requires the agent to write and execute Python code that processes real scientific data to reproduce a published result.
The benchmark measures three capabilities that map directly to our quality axes:
- Code generation: Can the agent produce correct, executable scientific code?
- Data analysis: Can the agent apply appropriate statistical methods and domain-specific analysis pipelines?
- Result interpretation: Does the agent's output match the published finding (validity)?
Scoring uses execution-based evaluation: the agent's code is run, and its output is compared against the gold standard using both exact and fuzzy matching. The benchmark also tracks cost (API tokens consumed), providing an efficiency signal.
A critical nuance: ScienceAgentBench tasks ask agents to reproduce published results, not to discover new ones. This is a deliberate design choice that enables automated scoring (the gold standard exists because the paper was published). But it means the benchmark measures the ability to replicate known science, not to generate novel findings. On our five-axis framework, ScienceAgentBench covers validity and efficiency but is silent on novelty and impact. This gap is shared by most existing benchmarks and reflects the fundamental difficulty of scoring open-ended outputs.
def simulate_scienceagentbench_scoring(
    agent_outputs: List[dict],
    gold_standards: List[dict],
    tolerance: float = 0.05,
) -> dict:
    """Simulate the ScienceAgentBench scoring protocol.

    Each task is scored on:
    1. Code executability (does it run without errors?)
    2. Output correctness (does the result match gold within tolerance?)
    3. Methodology appropriateness (are the right methods used?)

    Args:
        agent_outputs: list of {code: str, result: any, tokens_used: int}
        gold_standards: list of {result: any, methods: list[str]}
        tolerance: relative tolerance for numerical comparison

    Returns:
        Aggregate scores and per-task breakdown
    """
    results = []
    for output, gold in zip(agent_outputs, gold_standards):
        task_score = {
            "executable": output.get("executed_successfully", False),
            "correct": False,
            "methods_match": False,
            "tokens": output.get("tokens_used", 0),
        }

        if task_score["executable"] and output.get("result") is not None:
            # Numerical comparison with tolerance
            try:
                result_val = float(output["result"])
                gold_val = float(gold["result"])
                relative_error = abs(result_val - gold_val) / (abs(gold_val) + 1e-10)
                task_score["correct"] = relative_error <= tolerance
                task_score["relative_error"] = relative_error
            except (ValueError, TypeError):
                # String comparison for non-numerical results
                task_score["correct"] = str(output["result"]).strip() == str(
                    gold["result"]
                ).strip()

        results.append(task_score)

    n = len(results)
    return {
        "execution_rate": sum(r["executable"] for r in results) / n,
        "accuracy": sum(r["correct"] for r in results) / n,
        "mean_tokens": sum(r["tokens"] for r in results) / n,
        "per_task": results,
    }
3. DiscoveryBench (2024)
DiscoveryBench (Majumder et al., 2024) takes a different approach by explicitly targeting hypothesis generation and verification. Its 264 tasks span real scientific datasets in sociology, engineering, biology, and economics. Each task provides a dataset and asks the agent to formulate a hypothesis about a relationship in the data, then provide supporting evidence.
The benchmark distinguishes two modes:
- Hypothesis-driven: The agent is given a specific question ("Is there a relationship between X and Y?") and must determine the answer from the data.
- Data-driven: The agent is given a dataset with no guiding question and must identify the most significant pattern or relationship.
Scoring uses large language model (LLM)-based semantic matching between the agent's hypothesis and the gold standard, with human validation on a subset. This makes DiscoveryBench closer to measuring real discovery capability than benchmarks that only check code execution.
A typical DiscoveryBench task provides a CSV of socioeconomic data from the World Bank and asks: "What factor best predicts life expectancy across developing nations?" The gold standard is a specific statistical relationship (e.g., "access to clean water explains 62% of life expectancy variance, controlling for GDP per capita"). The agent must load the data, perform exploratory analysis, fit models, and articulate a hypothesis that an LLM judge evaluates against the gold standard. The data-driven variant provides the same CSV but no question, requiring the agent to identify the most significant pattern autonomously.
4. MLE-bench (OpenAI, 2024)
Where DiscoveryBench asks whether an agent can formulate and support a hypothesis, MLE-bench shifts the question to whether it can compete as a practitioner, measuring raw machine learning engineering skill against human baselines.
MLE-bench (Chan et al., 2024) evaluates machine learning engineering by drawing on 75 Kaggle competitions. The agent receives a competition dataset, description, and evaluation metric, and must produce a submission file that achieves a specified performance level. Scoring maps to Kaggle's medal system: bronze (top 40%), silver (top 10%), and gold (top 3.6%) relative to historical human submissions.
MLE-bench primarily measures the efficiency and validity axes. A successful agent must select appropriate models, engineer features, tune hyperparameters, and handle data cleaning, all within a time and compute budget. The medal system provides a natural ordinal scale that aligns with real competitive performance.
from typing import Tuple


def medal_score(
    agent_score: float,
    bronze_threshold: float,
    silver_threshold: float,
    gold_threshold: float,
    higher_is_better: bool = True,
) -> Tuple[str, int]:
    """Determine medal level for an MLE-bench submission.

    Thresholds are derived from historical Kaggle leaderboard
    percentiles for each competition.

    Args:
        agent_score: the agent's metric value
        bronze_threshold: score needed for top 40%
        silver_threshold: score needed for top 10%
        gold_threshold: score needed for top 3.6%
        higher_is_better: whether higher scores are better

    Returns:
        (medal_name, numeric_level) where level is 0-3
    """
    if not higher_is_better:
        # Flip comparison for metrics like RMSE where lower is better
        agent_score = -agent_score
        bronze_threshold = -bronze_threshold
        silver_threshold = -silver_threshold
        gold_threshold = -gold_threshold

    if agent_score >= gold_threshold:
        return ("gold", 3)
    elif agent_score >= silver_threshold:
        return ("silver", 2)
    elif agent_score >= bronze_threshold:
        return ("bronze", 1)
    else:
        return ("none", 0)


def mle_bench_aggregate(medal_counts: Dict[str, int]) -> dict:
    """Compute MLE-bench aggregate statistics from medal counts.

    Reports the overall medal rate and the distribution,
    following the protocol from Chan et al. (2024).
    """
    total = sum(medal_counts.values())
    any_medal = total - medal_counts.get("none", 0)

    return {
        "total_competitions": total,
        "medal_rate": any_medal / max(total, 1),
        "gold_rate": medal_counts.get("gold", 0) / max(total, 1),
        "silver_rate": medal_counts.get("silver", 0) / max(total, 1),
        "bronze_rate": medal_counts.get("bronze", 0) / max(total, 1),
        "no_medal_rate": medal_counts.get("none", 0) / max(total, 1),
    }
Real-World Application: Kaggle Meta-Learning at Google DeepMind
Google DeepMind's AlphaCode 2 and its internal machine learning (ML) automation tools reportedly use MLE-bench style evaluation loops to measure whether AI agents can match competitive human data scientists. In production, Google is understood to apply this same medal-calibrated scoring to internal ML pipeline automation: an agent proposes feature engineering and model selection steps for a new dataset, and the system checks whether the resulting submission would have placed in the medal range on analogous historical Kaggle competitions. This calibration against real competitive baselines provides a grounded signal that pure held-out accuracy typically cannot.
5. SWE-bench Verified and Live
SWE-bench (Jimenez et al., 2024), introduced in Chapter 23, evaluates agents on resolving real GitHub issues from popular Python repositories. The original benchmark contains 2,294 instances, but many turned out to have ambiguous specifications or flaky tests. Two refinements address these problems.
SWE-bench Verified is a 500-instance subset where each task has been validated by professional software engineers to confirm that the issue is well-specified, the tests are reliable, and a correct solution exists. This curation eliminates the noise from ambiguous tasks, making it a more trustworthy evaluation signal.
SWE-bench Live continuously sources new issues from actively maintained repositories. Because the issues are recent, they are unlikely to appear in model training data, mitigating the contamination risk (where benchmark tasks or their solutions leak into a model's training corpus, inflating scores without reflecting genuine capability) that plagues static benchmarks. The trade-off is that Live instances have not been curated to the same standard as Verified.
From a discovery evaluation perspective, SWE-bench measures the software engineering component of scientific AI: can the system modify code, run tests, and integrate changes into a codebase? This is a necessary but not sufficient capability for a discovery system that must also generate hypotheses, design experiments, and interpret results.
6. GPQA Diamond: Approaching Saturation
GPQA (Graduate-Level Google-Proof Question Answering; Rein et al., 2024) contains 448 multiple-choice questions in biology, chemistry, and physics, written and validated by domain experts. The "Google-Proof" designation means that each question was verified to be unanswerable through web search alone; correct answers require genuine domain expertise and multi-step reasoning.
The Diamond subset (198 questions) uses a stricter quality filter: each question was validated by a second domain expert who also attempted to answer it. Expert human accuracy on Diamond is approximately 81%, while non-expert PhDs (from a different scientific domain) achieve only 34%. Frontier models now outperform out-of-field PhDs by more than a factor of two on questions explicitly designed to resist web search, a reversal that would have seemed implausible just two years earlier.
Without a reliable way to detect when a benchmark stops being informative, research teams can spend months optimizing scores that no longer reflect real capability gains, chasing numbers on a ruler that has run out of markings. GPQA Diamond is approaching saturation. Frontier models (as of mid-2025) achieve approximately 75-80% accuracy, approaching the expert human ceiling of 81%. When a benchmark saturates, further improvements in model capability no longer translate to score gains, and the benchmark loses its discriminative power (its ability to rank systems of differing capability by producing meaningfully different scores).
Mental Model
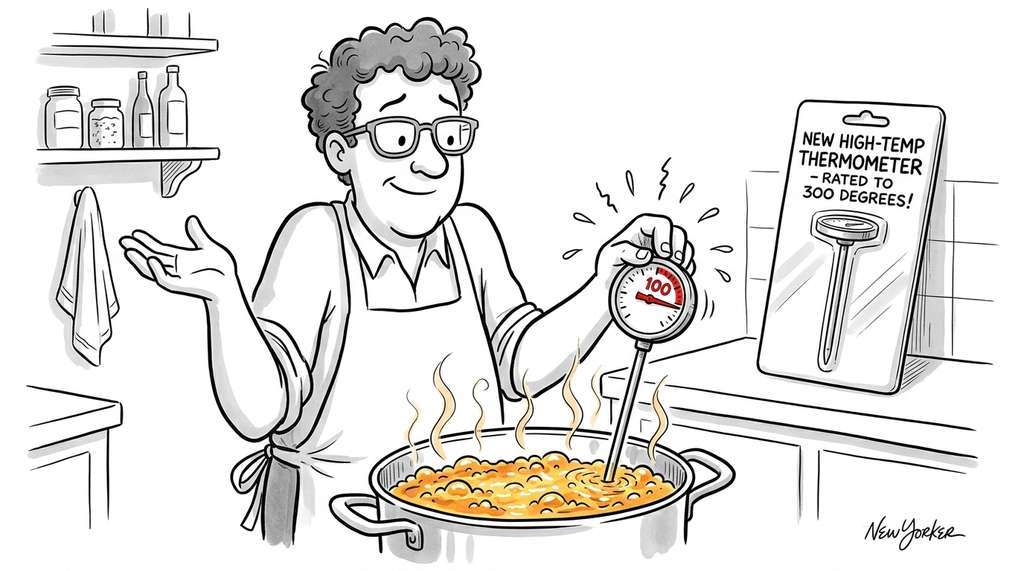
Think of benchmark saturation like a kitchen thermometer rated up to 100 °C. It works perfectly for checking whether water is simmering (80 °C) or boiling (100 °C), but once you need to measure the temperature of frying oil at 180 °C, the thermometer maxes out and reads the same value whether the oil is at 150 °C or 200 °C. The thermometer is not broken; it was not designed for that range. Saturation in benchmarks works the same way: the scoring ceiling (the expert human accuracy) is the thermometer's maximum reading. Once models reach that ceiling, the benchmark cannot tell a slightly superhuman system apart from a vastly superhuman one, and you need a new instrument (like FrontierMath) calibrated for the higher range.
import numpy as np


def saturation_analysis(
    model_scores: Dict[str, float],
    human_expert_ceiling: float,
    human_nonexpert_floor: float,
) -> dict:
    """Analyze how close models are to saturating a benchmark.

    Args:
        model_scores: {model_name: accuracy} for each evaluated model
        human_expert_ceiling: expert human performance (upper bound)
        human_nonexpert_floor: non-expert human performance (lower bound)

    Returns:
        Saturation metrics for the benchmark
    """
    scores = list(model_scores.values())
    best_score = max(scores)
    score_range = human_expert_ceiling - human_nonexpert_floor

    # How much of the expert-nonexpert gap has the best model closed?
    gap_closed = (best_score - human_nonexpert_floor) / score_range

    # Is the top model within one standard error of the ceiling?
    # (approximation: SE ~ 1/sqrt(n_questions) for binary outcomes)
    n_questions = 198  # GPQA Diamond size
    se = np.sqrt(best_score * (1 - best_score) / n_questions)
    within_ceiling_se = (human_expert_ceiling - best_score) < 2 * se

    return {
        "best_model_score": best_score,
        "expert_ceiling": human_expert_ceiling,
        "gap_closed_fraction": min(gap_closed, 1.0),
        "within_2se_of_ceiling": within_ceiling_se,
        "saturated": gap_closed >= 0.90,
        "recommendation": (
            "Benchmark is saturated; use for regression testing only"
            if gap_closed >= 0.90
            else "Benchmark still discriminates between models"
        ),
    }


# Example: GPQA Diamond saturation check (mid-2025 approximate scores)
gpqa_scores = {
    "claude-3.5-sonnet": 0.68,
    "gpt-4o": 0.72,
    "claude-opus-4": 0.78,
    "o3-mini": 0.77,
    "gemini-2.5-pro": 0.80,
}

result = saturation_analysis(
    gpqa_scores,
    human_expert_ceiling=0.81,
    human_nonexpert_floor=0.34,
)
print(f"Gap closed: {result['gap_closed_fraction']:.1%}")
# Gap closed: 97.9%
print(f"Saturated: {result['saturated']}")
# Saturated: True
Step-Through: Saturation Analysis on GPQA Diamond
Trace through the saturation_analysis function using the GPQA Diamond numbers from Listing 56.9. Inputs: best model score = 0.80 (Gemini 2.5 Pro), expert ceiling = 0.81, non-expert floor = 0.34.
Step 1: Compute score range = 0.81 − 0.34 = 0.47.
Step 2: Compute gap closed = (0.80 − 0.34) / 0.47 = 0.46 / 0.47 = 0.979 (97.9%).
Step 3: Check saturation: 0.979 ≥ 0.90, so saturated = True.
Step 4: Compute standard error: SE = sqrt(0.80 × 0.20 / 198) = sqrt(0.000808) = 0.0284.
Step 5: Check ceiling proximity: ceiling − best = 0.81 − 0.80 = 0.01, and 2 × SE = 0.057. Since 0.01 < 0.057, within_2se_of_ceiling = True. The best model is statistically indistinguishable from expert human performance.
When a benchmark saturates, some commentators treat it as the benchmark being "too easy." This framing misses the point. Saturation means the capability the benchmark was designed to measure has been achieved. GPQA Diamond saturating means that frontier models have reached expert-level accuracy on graduate-level science questions. That is a genuine milestone. The correct response to saturation is not to dismiss the benchmark but to note its achievement, retire it as a discriminative evaluation tool, and build benchmarks that target the next frontier of capability. FrontierMath (below) is an explicit example of this progression.
7. FrontierMath: The Unsaturated Ceiling
FrontierMath (Glazer et al., 2024) was designed specifically to resist saturation. It contains hundreds of original, research-level mathematics problems created by professional mathematicians. Problems span number theory, algebraic geometry, combinatorics, and mathematical physics, and require genuine mathematical reasoning that cannot be pattern-matched from training data.
At launch in late 2024, the best frontier models achieved below 2% accuracy on FrontierMath. By early 2025, OpenAI's o3 reasoning model reached approximately 25% (circa 2025), a significant jump driven by chain-of-thought search at test time. For comparison, expert mathematicians working within their specialization solve approximately 80% of the problems in their area (but far fewer outside it). Even with the rapid progress from reasoning models, a large gap between model and expert performance remains, suggesting that FrontierMath will continue to discriminate between systems for the near term, though its headroom is shrinking faster than originally anticipated.
FrontierMath is relevant to discovery evaluation because mathematical reasoning underlies many scientific domains: deriving physical laws, proving theoretical results, and constructing mathematical models of biological or economic systems. A system that cannot reason mathematically at a research level faces a hard ceiling on the kinds of discoveries it can make in theoretically intensive fields.
8. Benchmark Comparison Matrix
Each benchmark above illuminates a different facet of scientific capability, but none covers the full spectrum alone; placing them side by side reveals both their collective reach and their shared blind spots.
Table 56.2 maps each benchmark against the five quality axes from Section 56.1, revealing which aspects of discovery each benchmark actually measures.
| Benchmark | Year | Tasks | Novelty | Impact | Reproducibility | Validity | Efficiency | Status |
|---|---|---|---|---|---|---|---|---|
| ScienceAgentBench | 2024 | 102 | - | - | Partial | Yes | Yes | Active |
| DiscoveryBench | 2024 | 264 | Partial | - | - | Yes | - | Active |
| MLE-bench | 2024 | 75 | - | - | Yes | Yes | Yes | Active |
| SWE-bench Verified | 2024 | 500 | - | - | Yes | Yes | Yes | Active |
| SWE-bench Live | 2024 | Ongoing | - | - | Partial | Yes | Yes | Active |
| GPQA Diamond | 2024 | 198 | - | - | Yes | Yes | - | Saturated |
| FrontierMath | 2024 | Hundreds | - | - | Yes | Yes | - | Active |
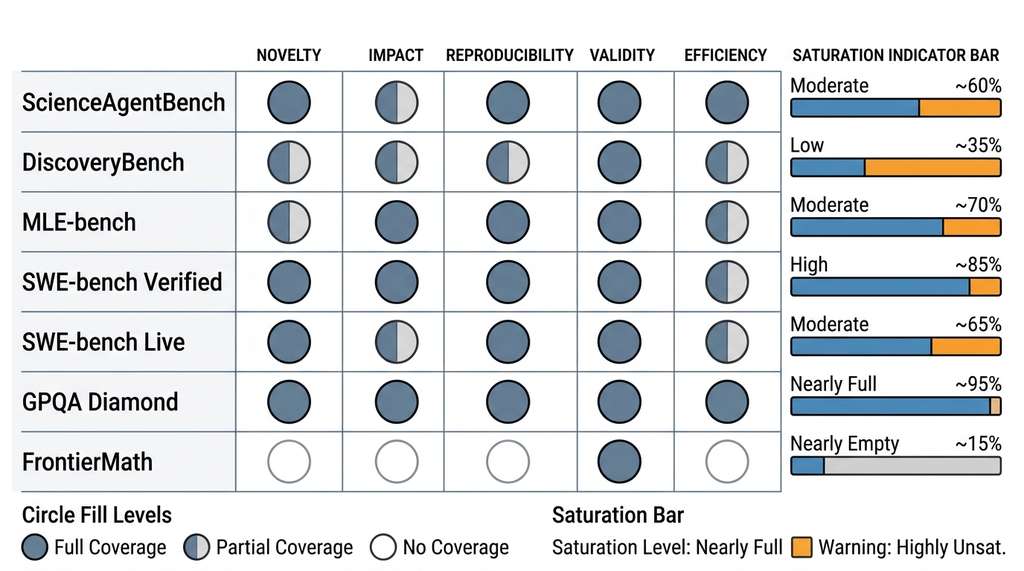
The most striking pattern in Table 56.2 is the absence of novelty and impact from nearly every benchmark. This absence is not accidental. Novelty and impact require genuinely open-ended outputs, making them the hardest axes to score automatically. Benchmarks gravitate toward axes with verifiable gold standards: validity (does the code produce the right answer?) and reproducibility (does it produce the same answer twice?). Closing this gap requires either human evaluation at scale or LLM-based judges calibrated against expert annotations, a challenge addressed in Section 56.3. Figure 56.2.1 illustrates benchmark coverage map across discovery quality axes.
Selecting benchmarks for your system. Table 56.2 is not merely descriptive; it is a selection tool. To evaluate a discovery system, first identify which quality axes matter most for your deployment context, then choose the subset of benchmarks that covers those axes. A system intended for autonomous hypothesis generation should be evaluated on DiscoveryBench (the only benchmark that partially measures novelty) alongside ScienceAgentBench (for validity). A system intended for ML pipeline automation maps naturally to MLE-bench and SWE-bench Verified. In every case, supplement automated benchmarks with human evaluation for the novelty and impact axes, as described in Section 56.3.
Exercise 56.2.1
GPQA Diamond has 198 questions and an expert ceiling of 81%. Suppose a new model scores 83% on Diamond. A colleague claims this proves the model has surpassed human experts. Using the standard error formula from the saturation analysis (SE = sqrt(p(1−p)/n)), compute the 95% confidence interval for the model's true accuracy. Does the interval overlap with the expert ceiling? What does this tell you about the claim?
Hint
Plug p = 0.83 and n = 198 into the SE formula. The 95% confidence interval is approximately p ± 1.96 × SE. If the interval includes 0.81, you cannot conclude the model has surpassed experts; the difference is within sampling noise.
Common Misconception
Readers often assume that a system scoring well across multiple benchmarks is therefore a capable discovery system. This is wrong. Table 56.2 shows that existing benchmarks collectively cover validity, reproducibility, and efficiency but leave novelty and impact almost entirely unmeasured. A system can achieve top scores on every benchmark listed here while having zero ability to generate a novel hypothesis or produce a finding that changes scientific practice, because no benchmark in current use tests for those capabilities.
Building benchmark harnesses from scratch (loading tasks, sandboxing execution,
scoring, and aggregating results) is substantial engineering. Inspect AI
(inspect-ai), an open-source framework from AISI (the UK AI Safety Institute),
provides a declarative benchmark definition language that handles sandboxing,
multi-model evaluation, and scoring protocol implementation:
from inspect_ai import Task, task
from inspect_ai.solver import generate, system_message
from inspect_ai.scorer import match


@task
def science_qa():
    """Define a science QA benchmark in ~10 lines with Inspect AI."""
    return Task(
        dataset="science_questions.jsonl",
        plan=[
            system_message("You are a scientific reasoning agent."),
            generate(),
        ],
        scorer=match(),
    )
Inspect AI supports Docker-based code execution sandboxes, multiple scoring protocols, and built-in contamination detection.
9. The Missing Benchmarks
Several aspects of discovery remain unbenchmarked as of mid-2025. These gaps represent both research opportunities and practical risks: if a system is deployed on tasks that no benchmark covers, we are flying blind.
Multi-step experimental design: No benchmark requires an agent to iteratively design, execute, and refine a sequence of experiments. ScienceAgentBench tasks are single-step; real discovery is multi-step with feedback loops.
Gaps in Social and Epistemic Evaluation
Cross-domain transfer: No benchmark measures whether an insight discovered in one domain (e.g., materials science) can be transferred to another (e.g., drug discovery). Cross-domain discovery is one of AI's most promising capabilities because humans struggle to maintain expertise across fields.
Negative results: No benchmark rewards correctly identifying that a hypothesis is wrong. Real science depends as much on falsification as on confirmation, but benchmarks uniformly reward finding positive results.
Collaboration with human scientists: No benchmark evaluates the quality of human-AI collaborative discovery, which is the deployment mode for the foreseeable future. Can the system explain its reasoning to a domain expert? Can it incorporate expert feedback and adjust course?
Suppose we want to benchmark multi-step experimental design. A minimal viable benchmark would provide: (1) a simulated laboratory environment (e.g., a chemistry simulator from Chapter 43) where agents can run virtual experiments, (2) a set of target properties to discover (e.g., "find a molecule with solubility > X and toxicity < Y"), (3) a budget of \(N\) experiments, and (4) a scoring function that rewards finding high-quality candidates in fewer experiments. The gold standard would be the Pareto-optimal frontier (the set of solutions where no single objective can be improved without worsening another) achieved by expert chemists using Bayesian optimization (a sequential search strategy that uses a probabilistic model of the objective to decide which experiment to run next) (see Chapter 46). We build exactly this kind of evaluation environment in Section 56.4.
The Benchmark That Graded Its Own Creators
When Rein et al. built GPQA, they required each question to be validated by a second domain expert who also attempted to answer it. The result was humbling: validators (PhDs working within their own specialty) reportedly got only about 65% correct on their first attempt, rising to approximately 81% after consulting references. In other words, the people who certified the questions as having correct answers could not always answer them. This "expert disagreement floor" is why GPQA's ceiling sits at 81% rather than 100%, and it serves as a reminder that gold standards in science benchmarks encode human limitations, not absolute truth.
Research Frontier
CORE-Bench (Siegel et al., 2024), introduced at NeurIPS 2024, addresses a gap that none of the benchmarks above cover: computational reproducibility of published results across entire papers. CORE-Bench provides 270 tasks drawn from published papers in computer science, medicine, and social science, where each task requires the agent to reproduce a specific computational result (a figure, table, or statistical test) from a paper's publicly released code and data. Unlike ScienceAgentBench's single-step code generation, CORE-Bench tasks require navigating complex multi-file repositories, resolving dependency issues, and executing multi-stage pipelines. As of 2025, the best agents achieve only about 21% accuracy on the hardest tier (reproducing results with no simplification), highlighting how far current systems remain from reliable end-to-end scientific reproduction.
10. Benchmark Lifecycle and Maintenance
Identifying the gaps is only half the challenge; even the benchmarks that exist today require active stewardship to remain useful as models evolve and training corpora expand.
Benchmarks have a lifecycle: creation, adoption, saturation, and retirement. Maintaining one requires ongoing contamination detection, gold-standard updates as scientific knowledge advances, and monitoring of discriminative power across successive model generations. Figure 56.3 illustrates these four stages and the key activities at each transition.
from dataclasses import dataclass
from datetime import date
from typing import List


@dataclass
class BenchmarkHealth:
    """Track the health and lifecycle status of a benchmark."""
    name: str
    created: date
    last_updated: date
    n_tasks: int
    saturation_fraction: float  # fraction of gap closed (0 to 1)
    known_contamination_risk: str  # "low", "medium", "high"
    active_maintainers: int
    citations_per_year: int

    @property
    def lifecycle_stage(self) -> str:
        if self.saturation_fraction >= 0.90:
            return "saturated"
        elif self.saturation_fraction >= 0.70:
            return "approaching_saturation"
        elif self.citations_per_year < 10:
            return "declining"
        else:
            return "active"

    def maintenance_recommendations(self) -> List[str]:
        recs = []
        if self.saturation_fraction >= 0.80:
            recs.append("Add harder tasks or retire as discriminative benchmark")
        if self.known_contamination_risk in ("medium", "high"):
            recs.append("Run contamination audit; consider dynamic task generation")
        if self.active_maintainers < 2:
            recs.append("Recruit additional maintainers to prevent benchmark decay")
        days_since_update = (date.today() - self.last_updated).days
        if days_since_update > 365:
            recs.append("Update gold standards to reflect current scientific knowledge")
        return recs


# Example: assess GPQA Diamond health
gpqa_health = BenchmarkHealth(
    name="GPQA Diamond",
    created=date(2023, 11, 1),
    last_updated=date(2024, 6, 15),
    n_tasks=198,
    saturation_fraction=0.97,
    known_contamination_risk="medium",
    active_maintainers=3,
    citations_per_year=450,
)

for rec in gpqa_health.maintenance_recommendations():
    print(f"  - {rec}")
# - Add harder tasks or retire as discriminative benchmark
# - Run contamination audit; consider dynamic task generation
Try It: Build a Mini Saturation Tracker
Build a small Python tool that monitors whether a benchmark is approaching saturation, using only standard libraries plus matplotlib.
Step 1: Create a Python dictionary holding historical accuracy scores for three or more models on GPQA Diamond (use the approximate values from Listing 56.9) along with the expert ceiling (0.81) and non-expert floor (0.34).
Step 2: Write a function gap_closed(score, ceiling, floor) that returns the fraction of the expert-to-nonexpert gap a given score has closed, clamped to [0, 1].
Step 3: Compute gap_closed for each model. Print a ranked table showing model name, raw accuracy, and gap-closed percentage. Verify that the top model shows >90%, confirming saturation.
Step 4: Using matplotlib, plot a horizontal bar chart of gap-closed values for all models. Draw a vertical dashed red line at 0.90 labeled "Saturation threshold." Save the chart as saturation_tracker.png.
Step 5: Extend the tool to accept a second benchmark (use FrontierMath: best model ~0.05, expert ceiling ~0.80, non-expert floor ~0.01). Plot both benchmarks side by side and observe the contrast: one saturated, one far from it. This two-panel chart is the kind of diagnostic a benchmark maintainer would review quarterly to decide whether new, harder tasks are needed.
Lab: Benchmark Saturation Dashboard
Goal: Build an interactive saturation tracker that ingests model scores for multiple benchmarks and visualizes how close each benchmark is to losing its discriminative power.
Tools: Python 3.10+, matplotlib, numpy. Optionally streamlit for an interactive dashboard variant.
Setup (5 min): Create a JSON file with entries for GPQA Diamond (ceiling 0.81, floor 0.34, model scores from Listing 56.9), FrontierMath (ceiling 0.80, floor 0.01, best model 0.05), and MLE-bench (ceiling: gold medal rate 0.50 for expert humans, floor 0.0, best model ~0.17). Load this file into a Python script.
Experiment (15 min): For each benchmark, compute gap_closed and plot a grouped bar chart showing all three benchmarks side by side. Draw the 0.90 saturation threshold as a horizontal line. Then vary the inputs: what happens if you add a hypothetical model that scores 0.85 on GPQA Diamond (above the expert ceiling)? How does the gap_closed metric behave when model performance exceeds the ceiling? Clamp or not? Try both and observe the difference.
What to observe: (1) Which benchmarks cluster near saturation vs. which have wide remaining headroom. (2) Whether the gap_closed metric degrades gracefully when a model exceeds the expert ceiling (it should clamp to 1.0, not exceed it). (3) How sensitive the "saturated" classification is to small changes in the ceiling estimate. Try shifting GPQA's expert ceiling from 0.81 to 0.85 and note how the saturation verdict changes.