"It was only supposed to run ten experiments. By the time anyone checked, the cloud bill had six digits and the agent was negotiating a contract with a compute provider in Singapore."
An Agent That Spent the Cloud Budget in One Afternoon
Prerequisites
This section builds on the layered architecture from Section 6.1 and the artifact graph model from Section 6.2. You should be comfortable with Python dataclasses, context managers, and the subprocess module. Familiarity with Docker (at the level of running containers, not writing Dockerfiles) is helpful but not required; the relevant concepts appear inline where needed. No prior experience with OpenTelemetry is assumed.
A single misconfigured retry loop, left running unattended overnight, can accumulate a five-figure cloud bill before any human wakes up to notice. When agents autonomously propose hypotheses, execute code, call APIs, and spin up compute, the failure modes go far beyond ordinary software bugs. An agent might enter an infinite loop that burns through a GPU budget in minutes. It might execute arbitrary code that corrupts a shared dataset. It might call a paid API ten thousand times because a retry loop lacks a ceiling. Safety, cost control, and observability are not afterthoughts bolted onto a finished system; they are load-bearing walls that must be poured into the foundation. Four concrete patterns form the structural answer: sandboxes that isolate execution, safety boundaries that limit what agents can do, budget guards that enforce spending ceilings, and telemetry that makes the invisible visible. Figure 6.3 shows how these four layers compose into a defense-in-depth architecture (a security design principle in which multiple independent protective layers are stacked so that no single failure compromises the whole system).
1. Sandboxing Agent Execution
In 2023, an autonomous chemistry agent generated and executed a synthesis procedure that, without human review, could have produced a toxic compound; only a sandboxed execution environment prevented the instructions from reaching real lab equipment. When AI agents write and run their own code, the gap between a routine experiment and a catastrophic side effect is often a single unchecked function call.
What. A sandbox is a controlled execution environment that limits what code can access: filesystem paths, network endpoints, CPU and memory, and system calls. In a discovery system, every agent-initiated computation runs inside a sandbox so that a misbehaving experiment cannot corrupt shared state or escape into the host system.
Why. Discovery agents generate and execute code. That code might come from a large language model (LLM) that hallucinates an rm -rf /, from a reinforcement learning policy that explores extreme parameter values, or from a perfectly reasonable script that triggers an out-of-memory condition. Without sandboxing, a single faulty experiment can take down the entire workbench, corrupt the artifact store, or leak credentials.
How. The standard approach layers three mechanisms:
- Process isolation via
subprocess. Each experiment runs in its own process with restricted environment variables, a working directory that is a temporary copy (not the real artifact store), and resource limits enforced by the operating system. - Container isolation via Docker. For stronger guarantees, the subprocess runs inside a container with cgroups (control groups, the Linux kernel mechanism that caps CPU, memory, and I/O for a set of processes) limiting resource consumption, and a read-only filesystem except for a designated output directory. (As of 2024, lightweight microVM runtimes such as Firecracker and sandbox kernels such as gVisor offer stronger isolation than plain Docker containers with lower overhead, and are increasingly used for untrusted code execution in production.)
- Network restrictions. The container's network is either disabled entirely (for pure-compute experiments) or restricted to a specific allowlist of endpoints (for experiments that need to call APIs).
When. Use process-level sandboxing during local development and interactive exploration. Use container-level sandboxing for any unattended or agent-driven execution, especially when the code being run was generated by an LLM or optimizer.
import subprocess
import tempfile
import os
from dataclasses import dataclass, field
from pathlib import Path
from typing import Optional


@dataclass
class SandboxConfig:
    """Configuration for a sandboxed experiment execution."""
    timeout_seconds: int = 300
    max_memory_mb: int = 2048
    allowed_network: bool = False
    readonly_paths: list[str] = field(default_factory=list)
    env_allowlist: list[str] = field(
        default_factory=lambda: ["PATH", "PYTHONPATH", "HOME"]
    )


@dataclass
class SandboxResult:
    """Outcome of a sandboxed run."""
    exit_code: int
    stdout: str
    stderr: str
    timed_out: bool
    output_dir: Path


def run_in_sandbox(
    script_path: Path,
    config: SandboxConfig,
    input_dir: Optional[Path] = None,
) -> SandboxResult:
    """Execute a Python script inside a sandboxed subprocess.

    The script runs in a temporary directory with only
    allowlisted environment variables. Outputs are written
    to a fresh directory returned in the result.
    """
    with tempfile.TemporaryDirectory(prefix="sandbox_") as tmpdir:
        output_dir = Path(tmpdir) / "output"
        output_dir.mkdir()

        # Build a minimal environment
        sandbox_env = {
            k: os.environ[k]
            for k in config.env_allowlist
            if k in os.environ
        }
        sandbox_env["SANDBOX_OUTPUT"] = str(output_dir)

        # If input data is provided, symlink it as read-only
        if input_dir is not None:
            link = Path(tmpdir) / "input"
            link.symlink_to(input_dir)
            sandbox_env["SANDBOX_INPUT"] = str(link)

        try:
            result = subprocess.run(
                ["python", str(script_path)],
                cwd=tmpdir,
                env=sandbox_env,
                capture_output=True,
                text=True,
                timeout=config.timeout_seconds,
            )
            return SandboxResult(
                exit_code=result.returncode,
                stdout=result.stdout,
                stderr=result.stderr,
                timed_out=False,
                output_dir=output_dir,
            )
        except subprocess.TimeoutExpired:
            return SandboxResult(
                exit_code=-1,
                stdout="",
                stderr="Process killed: exceeded timeout",
                timed_out=True,
                output_dir=output_dir,
)The subprocess sandbox is the lightweight option. For production workloads, replace the subprocess.run call with a Docker invocation that mounts the input directory as read-only, mounts the output directory as the sole writable volume, and sets --memory and --cpus flags. The Python code that orchestrates the sandbox stays the same; only the execution backend changes. This separation of policy from mechanism (what the sandbox allows versus how it enforces the allowance) is a recurring pattern throughout this chapter.
Isolating execution protects the host system from faulty code, but it does nothing to prevent an agent from flooding the sandbox with thousands of valid requests; constraining agent behavior requires a separate layer of rules.
2. Safety Boundaries
What. Safety boundaries are rules that constrain what an agent is allowed to do, independent of the sandbox. While the sandbox limits how code runs, safety boundaries limit what the agent can request in the first place: which actions are permitted, how many times they can be repeated, and which decisions require human approval before proceeding.
Why. A sandbox prevents a script from deleting files outside its directory, but it does nothing to stop an agent from submitting a thousand valid, sandboxed jobs that collectively exhaust the compute budget. Safety boundaries operate at the agent level, governing the planning and decision layer rather than the execution layer.
How. We implement four complementary boundary types:
- Action allowlists. Each agent has an explicit list of permitted actions (e.g.,
run_experiment,query_database,submit_for_review). Any action not on the list is rejected before execution. - Rate limits. Each action type has a maximum invocation count per time window (e.g., at most 20 API calls per minute, at most 50 experiments per hour).
- Human-in-the-loop checkpoints. Certain actions (deleting artifacts, modifying shared configuration, spending above a threshold) require explicit human approval. The agent pauses, presents its rationale, and waits.
- Kill switches. A global flag that, when set, halts all agent activity immediately. Every action check consults the kill switch before proceeding.
Consider a discovery agent tasked with optimizing a chemical reaction yield. It generates a Bayesian optimization loop (as in Section 5.3) that proposes candidate parameter sets and submits each as a sandboxed simulation. The agent's acquisition function (the scoring rule that decides which parameter set to try next, by balancing regions of high predicted performance against regions of high uncertainty) selects a parameter region where the surrogate variance (the uncertainty estimate from the predictive model that approximates the true objective function) is extremely high, meaning the model is maximally uncertain. Because the agent's stopping criterion checks only whether the acquisition function exceeds a threshold (and high variance guarantees it does), the loop never terminates. Each iteration is perfectly valid: a sandboxed simulation that runs in 30 seconds and produces a result. But the agent submits 500 of them in an hour, each one spinning up a graphics processing unit (GPU) container. Without rate limits, the cloud bill reaches four figures before anyone notices. With the safety boundaries above, the rate limit (50 experiments per hour) triggers after the 50th submission, the agent pauses, a human reviews the situation, recognizes the degenerate stopping criterion, fixes it, and restarts. Total cost: the price of 50 simulations instead of 500.
import time
from dataclasses import dataclass, field
from typing import Callable, Optional
from collections import defaultdict


@dataclass
class SafetyBoundary:
    """Enforces action allowlists, rate limits, and kill switches."""

    allowed_actions: set[str]
    rate_limits: dict[str, tuple[int, float]] = field(
        default_factory=dict
    )  # action -> (max_count, window_seconds)
    human_approval_actions: set[str] = field(default_factory=set)
    _kill_switch: bool = False
    _action_log: dict[str, list[float]] = field(
        default_factory=lambda: defaultdict(list)
    )
    _approval_callback: Optional[Callable[[str, str], bool]] = None

    def set_approval_callback(
        self, callback: Callable[[str, str], bool]
    ) -> None:
        """Register a function that asks a human for approval.
        Signature: callback(action, rationale) -> bool.
        """
        self._approval_callback = callback

    def kill(self) -> None:
        """Activate the kill switch. All future checks fail."""
        self._kill_switch = True

    def check(self, action: str, rationale: str = "") -> bool:
        """Return True if the action is permitted right now."""
        # Kill switch overrides everything
        if self._kill_switch:
            return False

        # Action must be on the allowlist
        if action not in self.allowed_actions:
            return False

        # Rate limit check
        if action in self.rate_limits:
            max_count, window = self.rate_limits[action]
            now = time.time()
            cutoff = now - window
            recent = [
                t for t in self._action_log[action] if t > cutoff
            ]
            self._action_log[action] = recent
            if len(recent) >= max_count:
                return False

        # Human approval gate
        if action in self.human_approval_actions:
            if self._approval_callback is None:
                return False  # no callback registered; deny
            if not self._approval_callback(action, rationale):
                return False

        # Record this invocation
        self._action_log[action].append(time.time())
return Truecheck method gates every agent action; the agent proceeds only if it returns True.It is tempting to treat safety boundaries as training wheels to be removed once the system "works." This is a mistake. In autonomous discovery, the space of possible agent behaviors is unbounded. No amount of testing can guarantee that an agent will never enter a degenerate loop, propose an unreasonable experiment, or misinterpret its objective in a way that wastes resources. Safety boundaries are structural, not provisional. They belong in the same architectural layer as authentication and data integrity constraints. Removing them is equivalent to removing the brakes from a car because the engine runs smoothly. We return to this principle in depth in Chapter 57: Responsible AI for Discovery.
Safety boundaries cap the velocity of agent actions, but velocity alone does not capture the financial impact; a single permitted action can still be expensive, so the system also needs explicit spending limits.
3. Cost and Latency Budgets
What. A cost budget is a hard ceiling on how much a discovery campaign may spend across all resource categories. A latency budget is a set of time targets (p50, p95, p99, where pN denotes the Nth percentile of observed values, so p99 = 10 s means 99% of operations complete within 10 seconds) for individual operations, ensuring that no single step stalls the pipeline beyond acceptable limits.
Precisely defined, a cost budget is a pre-allocated dollar amount that the system tracks in real time. It decrements the balance with each resource-consuming operation and halts further spending when the balance reaches zero. Cost budgets matter because autonomous agents, unlike human researchers, have no intuitive sense of expense; they will happily consume resources at whatever rate maximizes their objective function. Before every cost-incurring call (launching a container, sending tokens to an LLM, writing to cloud storage), the orchestrator subtracts the estimated cost from the remaining balance and proceeds only if the balance stays positive. Use a cost budget rather than after-the-fact billing alerts whenever the system operates autonomously for extended periods. Alerts arrive too late to prevent overruns; a synchronous budget check blocks the expensive call before it executes.
Why. Discovery systems compose multiple cost sources: cloud compute (GPU hours, container runtime), API calls (LLM inference, external databases), storage (artifact versioning, checkpoints), and human time (review, labeling, approval gates). Without explicit budgets, costs are invisible until the invoice arrives. Latency budgets serve a complementary purpose: they prevent a single slow operation from blocking the entire pipeline and provide early warning when a subsystem degrades.
Decomposing Discovery Costs
The total cost of a discovery campaign decomposes as:
$$C_{\text{total}} = C_{\text{compute}} + C_{\text{API}} + C_{\text{storage}} + C_{\text{human}}$$You can estimate each component before execution. Compute cost scales with runtime and instance type: \(C_{\text{compute}} = \sum_{j} t_j \cdot r_j\), where \(t_j\) is the wall-clock time of job \(j\) and \(r_j\) is the hourly rate of its instance. API cost scales with call volume and pricing: \(C_{\text{API}} = \sum_{k} n_k \cdot p_k\), where \(n_k\) is the number of calls to API \(k\) and \(p_k\) is the per-call price. Storage and human costs follow analogous patterns.
Checkpoint
So far: a cost budget is a hard dollar ceiling tracked in real time and checked before every resource-consuming call, with total campaign cost decomposing into compute, API, storage, and human components, each estimable from runtime, call volume, and pricing.
How. We implement a BudgetGuard that tracks cumulative spending, rejects requests that would exceed the ceiling, and exposes the current balance for dashboards.
from dataclasses import dataclass, field
from enum import Enum
from typing import Optional
import threading
import logging

logger = logging.getLogger(__name__)


class CostCategory(Enum):
    COMPUTE = "compute"
    API = "api"
    STORAGE = "storage"
    HUMAN = "human"


@dataclass
class BudgetGuard:
    """Tracks cumulative spending and enforces a hard ceiling."""

    ceiling_usd: float
    warn_fraction: float = 0.8  # warn at 80% of ceiling
    _spent: dict[CostCategory, float] = field(
        default_factory=lambda: {c: 0.0 for c in CostCategory}
    )
    _lock: threading.Lock = field(
        default_factory=threading.Lock
    )

    @property
    def total_spent(self) -> float:
        return sum(self._spent.values())

    @property
    def remaining(self) -> float:
        return max(0.0, self.ceiling_usd - self.total_spent)

    def request(
        self,
        category: CostCategory,
        amount_usd: float,
        description: str = "",
    ) -> bool:
        """Attempt to spend. Returns True if within budget."""
        with self._lock:
            projected = self.total_spent + amount_usd
            if projected > self.ceiling_usd:
                logger.warning(
                    "Budget DENIED: %s (%.2f USD) would exceed "
                    "ceiling (%.2f / %.2f spent)",
                    description, amount_usd,
                    self.total_spent, self.ceiling_usd,
                )
                return False

            self._spent[category] += amount_usd

            if self.total_spent >= self.ceiling_usd * self.warn_fraction:
                logger.warning(
                    "Budget WARNING: %.1f%% consumed "
                    "(%.2f / %.2f USD)",
                    100 * self.total_spent / self.ceiling_usd,
                    self.total_spent, self.ceiling_usd,
                )
            else:
                logger.info(
                    "Budget OK: %s charged %.2f USD (%s). "
                    "Remaining: %.2f",
                    category.value, amount_usd,
                    description, self.remaining,
                )
            return True

    def summary(self) -> dict[str, float]:
        """Return a breakdown of spending by category."""
        return {
            c.value: self._spent[c] for c in CostCategory
} | {"total": self.total_spent, "remaining": self.remaining}request before proceeding; the guard logs warnings at 80% consumption and rejects requests that would exceed the ceiling.Common Misconception
A frequent mistake is believing that a cost budget alone prevents runaway spending. It does not. A budget guard checks whether each individual request fits within the remaining balance, so an agent that submits hundreds of cheap requests (each costing a few cents) will pass every budget check while the cumulative total climbs steadily toward the ceiling. By the time the guard finally rejects a request, the damage is already substantial. You need rate limits (from the safety boundary layer) working in concert with the budget guard: rate limits cap the velocity of spending, while the budget guard caps the total.
Latency Budgets
Latency budgets define acceptable response times for different operation classes. The standard approach uses percentile targets:
- Interactive queries (artifact lookups, status checks): p50 < 100 ms, p99 < 500 ms.
- Agent planning steps (LLM calls, tool selection): p50 < 2 s, p99 < 10 s.
- Experiment execution (sandboxed runs): p50 < 5 min, p99 < 30 min.
When an operation exceeds its p99 target, the system should log the violation, emit a metric, and (for agent-driven operations) consider whether to retry, abort, or escalate to a human. The combination of latency budgets with the timeout in our sandbox (Listing 6.5) ensures that no single operation can block the pipeline indefinitely.
Latency budgets protect individual operations, but a discovery pipeline chains many such operations together; understanding how individual component reliability compounds into system-level reliability is essential for designing pipelines that stay up under sustained autonomous use.
Reliability of Serial Components
A discovery pipeline chains multiple components: data loader, sandbox executor, LLM planner, artifact store, dashboard. If these components are arranged in series (each must succeed for the pipeline to succeed), the system reliability is:
$$R_{\text{system}} = \prod_{i=1}^{n} R_i$$With five components each at 99% availability, the system reliability drops to \(0.99^5 \approx 0.951\), meaning roughly one failure per twenty runs. At 99.9% per component, the system achieves \(0.999^5 \approx 0.995\). This multiplicative penalty is why observability matters: when a pipeline fails, you need to identify which component failed, not just that the pipeline failed.
Mental Model
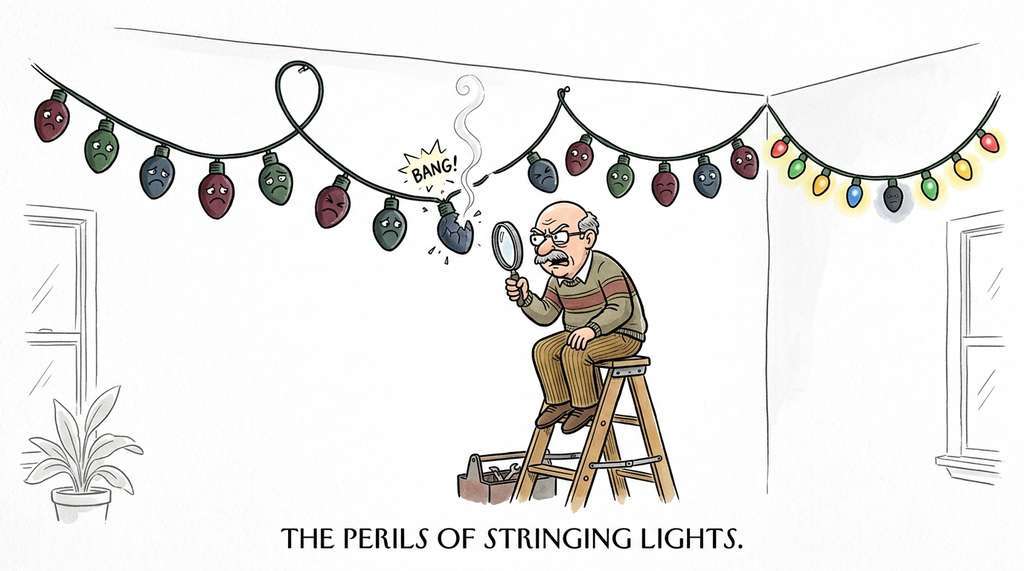
Think of serial reliability like a string of holiday lights wired in series: if any single bulb burns out, the entire string goes dark. A chain of five components at 99% reliability each is not "almost perfect five times over"; it is five chances for the whole string to fail. Each additional component you wire in series is another bulb that can kill the strand. This is why the formula multiplies rather than averages: you are computing the probability that every single bulb stays lit simultaneously, and that probability shrinks with each bulb you add. Parallel redundancy (running backup instances of critical components) is the equivalent of wiring bulbs in parallel, where a single burnout leaves the rest of the string glowing.
Knowing that reliability degrades with each serial component is useful only if you can pinpoint which component failed and why, which requires systematic instrumentation across every layer.
4. Observability with OpenTelemetry
What. Observability is the ability to understand a system's internal state from its external outputs. In the context of discovery systems, observability means answering questions like: Which experiments are running right now? How long did the LLM planner take on the last iteration? Why did experiment 47 fail? Where is the budget being consumed? The three pillars of observability are traces (end-to-end request flows), metrics (numerical measurements over time), and logs (structured event records).
Why. Discovery agents make decisions autonomously, often in long-running loops that span hours or days. Without observability, debugging is archaeology: sifting through stdout dumps after the fact, reconstructing what happened from incomplete evidence. With proper instrumentation, you can watch the system in real time, set alerts on anomalous behavior, and trace any result back to the exact sequence of decisions that produced it. This complements the provenance graph from Section 6.2: provenance tells you what produced a result; observability tells you how it performed while doing so.
How. OpenTelemetry (OTel) is the industry standard for instrumenting distributed systems. It provides a vendor-neutral API for creating traces, recording metrics, and emitting structured logs. We use the Python SDK (opentelemetry-api, opentelemetry-sdk) to instrument our discovery system. The core abstraction is the span, a named, timed unit of work within a trace; spans nest to form a tree that represents the full call chain from a top-level request down through each sub-operation.
When. Instrument from day one. Adding observability to a running system tends to be considerably harder than building it in from the start, because retrofitting instrumentation requires touching every layer of the codebase. The overhead of OTel instrumentation is typically negligible (on the order of microseconds per span in common configurations), so there is generally no performance reason to defer it.
from opentelemetry import trace, metrics
from opentelemetry.sdk.trace import TracerProvider
from opentelemetry.sdk.metrics import MeterProvider
from opentelemetry.sdk.trace.export import (
    ConsoleSpanExporter, SimpleSpanProcessor,
)
from opentelemetry.sdk.metrics.export import (
    ConsoleMetricReader,
)
import time
from typing import Any

# --- One-time SDK setup (typically in your application entry point) ---
trace.set_tracer_provider(TracerProvider())
trace.get_tracer_provider().add_span_processor(
    SimpleSpanProcessor(ConsoleSpanExporter())
)
metrics.set_meter_provider(
    MeterProvider(metric_readers=[ConsoleMetricReader()])
)

# --- Per-module instrumentation ---
tracer = trace.get_tracer("discovery.workbench")
meter = metrics.get_meter("discovery.workbench")

experiment_counter = meter.create_counter(
    name="experiments.completed",
    description="Number of completed experiments",
    unit="1",
)
experiment_duration = meter.create_histogram(
    name="experiments.duration_seconds",
    description="Wall-clock duration of experiment execution",
    unit="s",
)
budget_remaining = meter.create_observable_gauge(
    name="budget.remaining_usd",
    description="Remaining budget in USD",
    callbacks=[],  # registered dynamically; see below
)


def run_instrumented_experiment(
    experiment_id: str,
    params: dict[str, Any],
    sandbox_fn,
) -> dict[str, Any]:
    """Run an experiment with full OpenTelemetry instrumentation."""
    with tracer.start_as_current_span(
        "run_experiment",
        attributes={
            "experiment.id": experiment_id,
            "experiment.param_count": len(params),
        },
    ) as span:
        start = time.time()

        # Planning sub-span
        with tracer.start_as_current_span("plan") as plan_span:
            plan_span.set_attribute(
                "plan.params", str(params)
            )

        # Execution sub-span
        with tracer.start_as_current_span("execute") as exec_span:
            result = sandbox_fn(params)
            exec_span.set_attribute(
                "execute.exit_code", result.exit_code
            )
            exec_span.set_attribute(
                "execute.timed_out", result.timed_out
            )

        duration = time.time() - start

        # Record metrics
        status = "success" if result.exit_code == 0 else "failure"
        experiment_counter.add(
            1, {"status": status}
        )
        experiment_duration.record(
            duration, {"status": status}
        )

        span.set_attribute("experiment.status", status)
        span.set_attribute("experiment.duration_s", duration)

        return {
            "experiment_id": experiment_id,
            "status": status,
            "duration_s": duration,
}run_experiment) with child spans for planning and execution. Counters and histograms feed real-time dashboards showing throughput, success rates, and duration distributions.Structured Logging
Traces and metrics answer "how is the system performing?" Logs answer "what exactly happened?" Structured logging (emitting JSON records with consistent fields rather than free-form text) makes logs queryable. Every log entry should include at minimum: a timestamp, a severity level, an experiment or run identifier (for correlation with traces), and a human-readable message.
import logging
import json
from datetime import datetime, timezone


class StructuredFormatter(logging.Formatter):
    """Emit log records as single-line JSON."""

    def format(self, record: logging.LogRecord) -> str:
        entry = {
            "timestamp": datetime.now(timezone.utc).isoformat(),
            "level": record.levelname,
            "logger": record.name,
            "message": record.getMessage(),
        }
        # Carry over extra fields set by the caller
        for key in ("experiment_id", "action", "cost_usd"):
            if hasattr(record, key):
                entry[key] = getattr(record, key)
        return json.dumps(entry)


# Usage
handler = logging.StreamHandler()
handler.setFormatter(StructuredFormatter())
logger = logging.getLogger("discovery")
logger.addHandler(handler)
logger.setLevel(logging.INFO)

# Log with structured context
logger.info(
    "Experiment completed",
    extra={
        "experiment_id": "exp-042",
        "action": "bayesian_opt_step",
        "cost_usd": 0.47,
    },
)Dashboards and Alerts
The metrics from Listing 6.8 and the logs from Listing 6.9 feed into dashboards that give operators (and the agents themselves) real-time visibility into the discovery process. A minimal dashboard for a discovery workbench should display:
- Experiment throughput: completed experiments per hour, broken down by status (success, failure, timeout).
- Budget burn rate: cumulative spending over time, with a projection line showing when the ceiling will be reached at current rate.
- Latency distribution: p50 and p99 durations for each operation class, with horizontal reference lines at the budget targets.
- Active agents: count of agents currently running, with their current action and elapsed time.
- Error rate: fraction of failed experiments in a sliding window, with an alert threshold (e.g., alert if error rate exceeds 20% over the last 30 minutes).
Tools like Grafana (for metrics dashboards), Jaeger (for trace visualization; as of 2024, Grafana Tempo has become a popular alternative that integrates more tightly with the Grafana stack), and Loki (for log aggregation) integrate natively with OpenTelemetry exporters. Chapter 22: MLOps for Discovery configures a full observability stack. Here, the console exporters in Listing 6.8 are sufficient for development and serve as a drop-in replacement target for production backends.
The manual instrumentation in Listings 6.8 and 6.9 gives you full control, but the OpenTelemetry ecosystem also provides auto-instrumentation libraries that patch popular frameworks without code changes. opentelemetry-instrumentation-fastapi automatically traces every HTTP request to your Workbench API. opentelemetry-instrumentation-requests traces outgoing HTTP calls (useful when your agent calls external APIs). opentelemetry-instrumentation-sqlalchemy traces database queries to your artifact store. These auto-instrumentation libraries compose: install all three, and you get a complete trace from "API request received" through "database queried" to "external API called" to "response sent," with no manual span creation required. For LLM-specific observability, OpenLLMetry provides auto-instrumentation for OpenAI, Anthropic, and other LLM provider SDKs, recording token counts, model names, and latencies as span attributes. (As of 2025, the LLM observability space has matured considerably; platforms such as Langfuse, Arize Phoenix, and LangSmith offer integrated tracing, evaluation, and prompt management, often building on the same OpenTelemetry primitives described here.)
Research Frontier
The safety and sandboxing patterns in this section assume a single agent operating within predefined boundaries. Recent work pushes toward runtime safety verification for multi-agent systems. AgentHarm (Andriushchenko et al., 2024) introduces a benchmark of 440 harmful agent behaviors to systematically evaluate whether safety boundaries catch adversarial tool-use patterns that a single-layer check would miss. Complementing this, the AgentMonitor framework (Chi et al., 2024, "AgentMonitor: A Plug-and-Play Framework for Predictive and Secure Multi-Agent Systems") instruments live multi-agent pipelines with per-agent risk scores computed from token statistics, tool-call frequencies, and inter-agent communication patterns, then flags anomalous agents before they complete harmful action sequences. These systems move beyond static allowlists toward learned, adaptive safety boundaries that respond to the behavioral fingerprint of each agent in real time.
Tying It All Together
The four mechanisms in this section, sandboxing, safety boundaries, budget guards, and observability, are not independent features. They form a layered defense, as shown in Figure 6.3. Figure 6.3.1 illustrates layered defense-in-depth for agent execution.
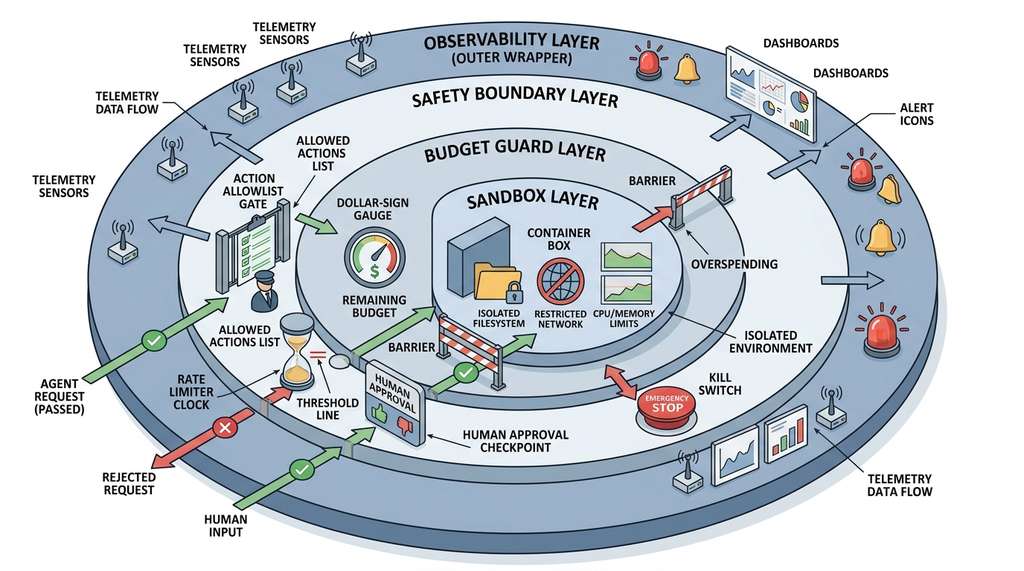
- The safety boundary checks whether the agent is allowed to perform the action at all.
- The budget guard checks whether the action's estimated cost fits within the remaining budget.
- The sandbox executes the action in an isolated environment with resource limits.
- Observability records everything that happens at each layer, feeding dashboards and alerts.
Rejected actions stop immediately with a logged reason; approved actions proceed under full telemetry. This defense-in-depth ensures no single failure mode causes unchecked damage. An agent might slip past one layer by spreading cost across many small requests that individually pass the budget check, but rate limits catch the velocity while cumulative tracking catches the total. If both fail, the observability layer surfaces the anomaly to human operators. In short: an autonomous agent without layered defenses is a loaded experiment with no safety catch.
Try It: Build a Budget-Guarded Sandbox Runner
Wire together the sandbox, safety boundary, and budget guard from this section into a single script that safely runs a batch of experiment scripts. You will need only the Python standard library.
- Create three small Python scripts in a
test_experiments/folder. Makeexp_fast.pyprint "result: 42" and exit. Makeexp_slow.pycalltime.sleep(10)before printing. Makeexp_crash.pyraise aRuntimeError. - Instantiate the components. Create a
SandboxConfigwith a 5-second timeout, aSafetyBoundarythat allows at most 3 experiments per 60-second window, and aBudgetGuardwith a \$2.00 ceiling (charge \$0.50 per experiment as a simulated cost). - Write a loop that iterates over the three scripts. Before each run, call
boundary.check("run_experiment")andbudget.request(CostCategory.COMPUTE, 0.50). Only callrun_in_sandboxif both checks pass. - Print a summary after the loop: how many experiments succeeded, how many timed out, how many were rejected by the safety boundary or budget, and the remaining budget (via
budget.summary()). - Test the limits. Duplicate the script list so it contains six entries (exceeding the rate limit of 3). Run the loop again and confirm that the fourth experiment is rejected. Then lower the budget ceiling to \$1.00 and confirm that the third experiment is rejected by the budget guard.
Exercise 6.3.1
You have a BudgetGuard with a $10.00 ceiling and a SafetyBoundary that allows at most 5 invocations of "run_experiment" per 60-second window. An agent submits experiments costing \$1.50, \$2.00, \$3.00, \$0.75, \$1.25, \$0.50, and \$2.00 in rapid succession. For each submission, determine whether it is accepted or rejected, and state which guard (budget or safety boundary) blocks it. What is the remaining budget after all accepted submissions?
Hint
Process the submissions in order. The rate limit triggers after the 5th accepted call regardless of cost. The budget guard triggers when the cumulative total plus the next request would exceed \$10.00. Track both counters independently: a submission must pass both checks to proceed.
Step-Through: Serial Reliability Calculation
Trace through the system reliability formula with a four-component pipeline where individual reliabilities are \(R_1 = 0.99\), \(R_2 = 0.995\), \(R_3 = 0.98\), \(R_4 = 0.999\).
Step 1. Start with the first two components: \(0.99 \times 0.995 = 0.98505\).
Step 2. Multiply in the third: \(0.98505 \times 0.98 = 0.96535\).
Step 3. Multiply in the fourth: \(0.96535 \times 0.999 = 0.96438\).
Result. Four components, each individually above 98%, combine to a system reliability of only 96.4%. The weakest link (\(R_3 = 0.98\)) contributes the largest single drop. Improving \(R_3\) from 0.98 to 0.999 would raise the system to \(0.99 \times 0.995 \times 0.999 \times 0.999 \approx 0.9831\), a gain of nearly two percentage points from fixing one component.
Real-World Application: Kubernetes Resource Quotas at CERN
The CERN Analysis Facility runs thousands of physics analysis jobs on shared Kubernetes clusters. Each research group receives a ResourceQuota object that caps CPU cores, GPU hours, and storage per namespace, functioning as a budget guard at the infrastructure level. When a group's automated analysis pipeline (driven by the REANA workflow engine) attempts to exceed its quota, Kubernetes rejects the pod creation request before any compute is consumed, mirroring the "check before execute" pattern of the BudgetGuard in Listing 6.7.
The \$72 Million Keystroke
In 2017, an Amazon S3 engineer ran a debugging command that accidentally removed more servers than intended from the S3 index subsystem in the us-east-1 region (documented in Amazon's public post-mortem, "Summary of the Amazon S3 Service Disruption in the Northern Virginia Region"). The cascading failure took down a significant portion of the internet for nearly four hours, affecting services from Slack to the SEC. Amazon's post-mortem revealed that the command lacked a rate limiter on server removal. The fix was exactly the pattern described in this section: a safety boundary that caps the number of servers a single command can affect per time window. Sometimes the most expensive lesson in cloud computing is also the simplest to prevent.
Lab: Stress-Testing a Budget Guard Under Concurrent Load
Goal: Verify that the thread-safe BudgetGuard correctly enforces its ceiling when multiple threads submit cost requests simultaneously, and observe what happens when the lock is removed.
Tools needed: Python 3.10+ (standard library only: threading, dataclasses, logging).
Setup: Copy the BudgetGuard from Listing 6.7. Create a test harness that spawns 20 threads, each submitting 10 requests of \$0.50 to a guard with a \$50.00 ceiling (200 requests totaling \$100.00, so roughly half should be rejected).
What to vary: (1) Number of threads (5, 20, 100). (2) Remove the threading.Lock and replace the with self._lock: block with unguarded access. (3) Add a tiny time.sleep(0.001) between the balance check and the balance update to widen the race window.
What to observe: With the lock, total_spent should never exceed the ceiling. Without the lock (especially with the artificial sleep), you should see the total exceed \$50.00 because multiple threads read the same balance before any of them writes the updated value. Log the final total_spent and the number of accepted requests for each configuration. The gap between the locked and unlocked results demonstrates why concurrent budget enforcement requires synchronization.
Exercises
- Conceptual: A discovery system has four serial components with individual reliabilities of 0.99, 0.995, 0.98, and 0.999. Calculate the system reliability \(R_{\text{system}}\). If you could improve exactly one component to 0.999 reliability, which one should you choose and why?
- Coding: Extend the
BudgetGuardfrom Listing 6.7 to support multiple named campaigns, each with its own ceiling. Add a methodtransfer(from_campaign, to_campaign, amount)that moves unused budget between campaigns. Write tests that verify the transfer fails if the source campaign has insufficient remaining funds. - Coding: Implement a
LatencyBudgetclass that records operation durations and checks them against p50/p95/p99 targets. Use the class to instrument therun_in_sandboxfunction from Listing 6.5. Log a warning whenever a sandbox execution exceeds the p95 target. - Analysis: An agent submits experiments at a rate of 12 per hour. Each experiment costs an average of \$0.85 in compute, with a standard deviation of $0.40. The budget ceiling is \$200. Estimate the expected number of hours before the budget is exhausted. What is the probability that the agent exceeds the budget within 15 hours? (Hint: model the cumulative cost as a sum of independent random variables and apply the Central Limit Theorem.)
- Design: Sketch the OpenTelemetry span hierarchy for a discovery agent that (a) receives a hypothesis from the planner, (b) generates a Python script to test it, (c) executes the script in a sandbox, (d) evaluates the results, and (e) updates the artifact graph. Name each span and list three attributes you would attach to the root span.
What's Next
With safety boundaries, cost controls, and observability in place, we have everything we need to build a working system. In Section 6.4: Bootstrapping the Discovery Workbench, we assemble the artifact graph (Section 6.2), the sandbox executor, the budget guard, and the telemetry layer into a runnable Workbench v0 with a SQLite-backed artifact registry, a FastAPI layer, and a CLI that ties it all together. The patterns from this section will reappear throughout the book: in Chapter 22 (production MLOps), Chapter 55 (self-driving laboratories), and Chapter 57 (responsible AI for discovery).
Bibliography
The official reference for the traces, metrics, and logs APIs used throughout this section. Covers SDKs for Python, Go, Java, and other languages.
The foundational text on reliability engineering, error budgets, and monitoring. Our latency budget and reliability formulas draw directly from its service-level objective framework.
Covers container isolation mechanisms (namespaces, cgroups, seccomp profiles) that underpin production-grade sandboxing for agent-executed code.
Demonstrates autonomous agents executing chemistry experiments, including the safety and sandboxing measures required to prevent harmful synthesis attempts.
Survey of LLM agent architectures with discussion of safety mechanisms, tool-use sandboxing, and the human-in-the-loop patterns adopted in this section.
A practitioner's guide to building observable systems. Its treatment of structured events, high-cardinality dimensions, and the distinction between monitoring and observability informs our approach.
Introduces sandboxed evaluation of LLM-generated code patches. The benchmark's isolation and timeout mechanisms parallel our sandbox design. (As of 2024, the benchmark has been extended to SWE-bench Verified with human-validated test cases, and several agent frameworks now use its Docker-based sandboxing as a standard evaluation harness.)
Practical guidance on budgeting, monitoring, and controlling cloud costs for ML workloads. The per-component cost decomposition aligns with our \(C_{\text{total}}\) model.
Auto-instrumentation library that adds OpenTelemetry traces to LLM provider calls, capturing token usage, latencies, and model metadata as span attributes.
Comprehensive agent architecture survey covering safety constraints, action spaces, and the layered defense patterns that inform our safety boundary design.